|
Appendix 6.
Olga Kashina.
The Russia’s Spherons over 50 years: 1970-2021 https://peacefromharmony.org/?cat=ru_c&key=899 DYNAMICS OF DISTRIBUTION OF THE RUSSIA POPULATION BY SPHERONS FOR 1970-2021.
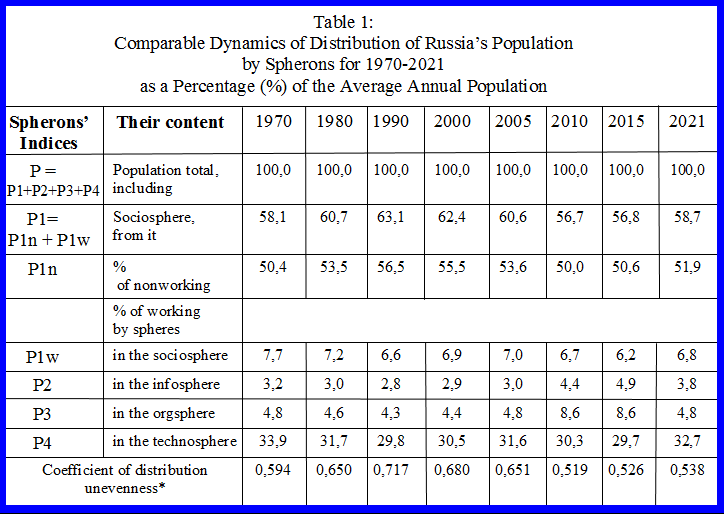
The main sources of information were the following statistical digests for 1970-2019 in printed edition: "Population of the Russian Federation by Sex and Age on January 1, ..."; "National Economy in ..."; "Russian Yearbook ..."; "Labor and Employment in Russia" and others. Unfortunately, since 2020, statistical digests have ceased to be published in printed form, and access to their electronic analogues is difficult on the RosStat website. As a result, the following comparable dynamics of the distribution of the population of Russia by spherons was obtained - see Table 1 Note: "The coefficient of distribution unevenness" characterizes the homogeneity of the structure and varies from 0 to 1. A value close to 0 characterizes the same prevalence of all parts in the structure of the population, that is, a uniform distribution and heterogeneity of the population. Its proximity to 1 means the predominance of one of the parts, that is, extreme unevenness of the structure, but homogeneity of the population. Since the population is predominantly represented by representatives of one of the selected groups in the structure. Data for 2021 are preliminary without taking into account the adjustment for the results of a sample survey on employment issues. Dr. Olga Kashina https://peacefromharmony.org/?cat=ru_c&key=757 16-03-25
Up
|
 Official Website")