| |
Chapter 2. Global Statistics of SPHERONS and Empirics of GPS PARAGRAPHS: 2.1. Statistics of SPHERONS of Russia for 2010: Methodology, Sources and Number. Olga Kashina and Leo Semashko 2.2. Statistics of SPHERONS of St. Petersburg in 2010: Number. Olga Kashina 2.3. Statistics of SPHERONS of India in 2010: Sources and Number 2.4. Statistics of SPHERONS of USA in 2010: Sources and Number 2.5. Statistics of SPHERONS of Germany in 2010: Sources and Number 2.6. Statistical Study of SPHERONS of Educational Institutions. Svetlana Kuskovskaya, Habyarimana Heli, Maitreyee Roy, Maria Azcona, Leela Pradhan, Ammar Banni 2.7. Monitoring: Dynamics of Peace and War Priorities in World Public Consciousness in 2014. Leo Semashko, Ivan Ivanov 2.8. Program of Statistical Study of SPHERONS of Educational Institutions 2.9. Dynamics of SPHERONS in Russia, India, USA and Kazakhstan for 1950-2010 by Decades 2.10. Perspectives and Significance of Global Spheral Statistics 2.1. Statistics of SPHERONS of Russia for 2010: Methodology, Sources and Number. Olga Kashina and Leo Semashko Contents 1.Tasks of Study 2.Definition of SPHERONS, Spheral Classes of the Population 3.Classification of SPHERONS: Spheral Indices 4.Sources of Statistics on Employment and Unemployment of the Population in Russia 5.Classification by Branches of Economic Activity and Categories of Personnel 6.Technique of Definition of Number of Russia SPHERONS Based on Statistics 7.Mid-year Population of the Russian Federation for 2010 8.Definition of Number of Non-working Population (P1n) in Russia for 2010 9.Number of SPHERONS in Russia for 2010 10.Number of SPHERONS in Russia for 1991 and 1996 11.Conclusion: Problems and Significance of the Study 12.References 1. Tasks of Study The purpose of our statistical study is to define the numerical distribution of the population in Russia on the spheral classes, SPHERONS, for 2010. To achieve this purpose in our work we solved the following tasks: ·Formed the definition of SPHERONS (spheral classes of the population); ·Formed the SPHERONS classification and their spheral indices; ·Created the technique of determining the number of SPHERONS in Russia based on statistics of the population of Russia; ·Examined the sources of statistics on employment and unemployment of the population of Russia; ·Reviewed classifications by the branches of economic activity and categories of personnel used in Russia currently; ·Collected data characterizing employment by the branches of economic activity, categories of personnel and non-working population; ·Conducted grouping of the Russian population by SPHERONS for 2010, which is expressed in their final table of number. The study signification is defined by the fact that people/population who constitute SPHERONS are the main productive force of society and are a priority social resource that produces all other resources of society, including the population itself. Therefore, statistics of the population, its employment and other qualities are particularly important, as is disclosed in the first chapter of this book. 2. Definition of SPHERONS, Spheral Classes of the Population The first chapter, especially paragraph 1.2, is devoted to this issue. We recount only the definition of it here. SPHERONS, which are spheral classes of the population, are the extremely large groups of people covered as a whole and employed in four spheres of social production of PIOT resources (People, Information, Organization, Things) and who differ on the main (on time) as being employed in one of the spheres. See also [5, 70]. Four spheres of production are: 1. Social sphere, or Sociosphere (S), the subject and product of which are people (P); 2. Information sphere, or Infosphere (I), the subject and product of which is information (I); 3. Organizational sphere or Orgsphere (O), the subject and product of which are organization, management, politics, law, finance, defense, etc. (O); 4. Technical (economic/environmental) sphere, or Technoecosphere (T), the subject and product of which are things, including all material goods and services (T). Together, these are called SIOT. Four SPHERONS, spheral classes, employed in these spheres SIOT are: 1. SOCIOCLASS, people employed in Sociosphere, subject and product of this class are P; 2. INFOCLASS, people employed in Infosphere, subject and product of this class is I; 3. ORGCLASS, people employed in Orgsphere, subject and product of this class is O; 4. TECHNOCLASS, people employed in Technoecosphere, subject and product of this class are T. See also [6, 33-43]. 3. Classification of SPHERONS: Spheral Indices SPHERONS, as a whole, and the individuals who make them differ by main (on time) employment in one of the four spheres of society. (Employment of SPHERONS was discussed in more detail in the first chapter, paragraph 1.6.). Employment defines each person’s universal life characteristics from birth to death. All other qualities of people, on which they differ, such as labor, property, power, education, and the like, are its partial manifestations and/or products. All the time within people’s livesis devoted to production of various social resources, including and above all, the continuation of life for themselves. Within multidimensional topology of vital employment of people vary its two principal clusters: 1. Self-production or autopoiesis is employment of each person by himself (“I”) from birth to death in processes such as eating, sleeping, learning, communication, recreation, etc. The term self-production (autopoiesis) was first introduced by Umberto Maturana and Francisco Varela (1973) for theoretical biology to describe the self-reproduction of living cells. In 1990, this term was reinterpreted in sociology by Niklas Luhmann to describe characteristics of human communication as a key element of social system. Autopoiesis belongs in Sociosphere because it includes all kinds of human activity except economic/labor activity, which stands out in a separate cluster of employment. 2. Labor or economic employment of people by other resources except “I”. As a rule, this is formally established within norms of labor activity of society. The labor activity is a part of self-production known as “seniority (work experience)” or “experience of labor activity.” It is part of each person’s life. These two clusters of employment divide the entire population into two parts: 1. Nonworking (economically inactive) population employed in Sociosphere by self-production. 2. Working or economically active population employed in all spheres. We express SPHERONS according to a special, spheral indices: P. Population/people in general for any level of school and from town to country to the world; P1. Socioclass who are employed in Sociosphere (first sphere); P1n. Non-working population who are employed in self-production of Sociosphere and forming part of the Socioclass; P1w. Working population who are employed in labor of industries/branches of Sociosphere and who constitute another part of the Socioclass. Therefore, P1 = P1n + P1w. P2. Infoclass who are employed in branches of Infosphere (second sphere); P3. Orgclass who are employed in branches of Orgsphere (third sphere); P4. Technoclass who are employed in branches of Technosphere (economic, fourth sphere). Each spheral class is a separate SPHERON covering part of the population employed in one of the four spheres of social production. In sum, the number of people in the four SPHERONS is the population as a whole. This is expressed by the simple formula: P = P1 (P1n + P1w) + P2 + P3 + P4 or Population/People = Socioclass (nonworkers + workers) + Infoclass + Orgclass + Technoclass. The purpose of this study is to determine the number of each SPHERONS within Russia in 2010, the sum of which is the population of Russia in 2010 as a whole. 4. Sources of Statistics on Employment and Unemployment of the Population in Russia Because the classification of population according to SPHERONS is an unknown statistic, the number can be determined indirectly by available statistics. In this study, we used three main sources of statistics on Russian employment and unemployment: • Data of Russia Population Census 2010 round (RPC-2010), published in 11 volumes [7; 8; 9; 10; 11]; • The Distribution of Employees of Enterprises and Organizations on Economic Activity Kinds on average for 2010. [2]; • Sample Data on the Number of Organizations’ Staff by the Activities Kinds and Staff Categories [2]. In 2010, the census enumerated the resident population of Russia. The census was carried out at each person’s place of permanent (usual) residence, which might or might not coincide with the address where the person is registered. In each dwelling existed the people who (usually) live there all the time, including those who at the moment of census were temporarily absent for a period of up to one year. The resident population is categorized by households: • private households; • collective households; • homeless households. The population living in private households, distributed by gender and age, were allocated as: • Children and adolescents aged 0-14 years; • The population aged 15-72 years; it is among the employed population in this age group that random observations about employment and professional composition of employees in the period after the census were conducted; • Persons aged 73 years and older. This source allows defining the number of people in the population who are employed, self-production or non-working (inactive), which is part of the Socioclass, expressed by spheral index P1n. 5. Classification by Branches of Economic Activity and Categories of Personnel In this study were used three statistical classifications, according to: 1. Economic activity; 2. Industries/branches/types/kinds of economic activity (activities); 3. Personnel/staff categories. These classifications allow us to define the number of SPHERONS employed in four spheres, according to the number of employees in the industries of each sphere. Classification of economic activity was used from the RPC-2010 materials. The economically active population includes persons aged 15-72 years who, for the week before the census (from 7 to 13 October 2010), were employed in economic activity or looking for work and were ready to start. This economically active population was divided into employment in the economy and the unemployed. (Unemployed busy self-production are included in P1n of Socioclass as one of SPHERONS). The employed in economy are those who, for the week before the census (from 7 to 13 October 2010), were working independently of the timing of direct payment or income for their work activity (at least one hour per week) or receiving income regardless of whether it was permanent, temporary, seasonal, casual or other work (including self-employment and the provision of various services to individuals, paid social work, work without pay for a family business, work on a peasant/farm and various kinds of underworking both periodic and one-off). The employed were considered also the persons who performed household work on the production of goods or services, including agriculture, forestry, hunting, fishing and its processing, if the products are intended for market. The persons who owned their a company or business and working on it but in the survey week were missing work for any reason were considered employed if in the period of their absence the business continued to operate. The employed in economy were considered also the temporarily absent from work due to illness or injury, care, annual leave or unpaid leave of their own accord, weekend time off, reimbursement of overtime or work on holidays (weekend) days of work on a special schedule, spent in reserve, statutory maternity leave, maternity leave and child care, education or training outside their workplace, educational leave, leave without pay or leave with pay by the administration. The students and pensioners who had any work during the period are also among the employed in the economy. Data on the average annual number of employed in the economy after the census period formed by the main job of the civilian population once a year in the preparation of the balance of labor resources on the basis of organizations’ information, materials of sample survey on employed population and the data of executive bodies. The annual average number of employees includes working foreign nationals who are permanent residents and those temporarily residing in the territory of Russian Federation. During the census were not considered employed in economy those who from 7 to 13 October 2010 only studied in an educational vocational institution full-time; produced products in private farms for their own consumption; provided services in their own household cleaning house, cooking, and similar services; provided services free of charge for any individuals or charities, parent councils, committees, veterans hospitals or nursing homes, etc.; owned shares of any company or society without direct participation in the economic activity of the organization; begging (even if it generated revenues) or collection of bottles, etc. The unemployed are those who in the survey week did not have a job (gainful employment) and: - Were seeking work and were available for work during the survey week. Finding a job is considered a public or commercial employment service; so is use of or placing ads in the media, direct appeal to the administration of a company or potential employer, and use of personal connections to promote oneself, and the organization of one’s own business; - Found a job and proceeded to it two weeks after the survey week; - Found a job and expected a response from the administration or the employer with a response waiting period not to exceed one month. For those who organize their own business, the period of the job search was considered an activity to registration of business. Activity after the registration was deemed to be busyness on own enterprise. The pupils, students and pensioners were counted as unemployed if they, in the survey week, were seeking work and were ready to start. Economically inactive population are people aged 15-72 years who were not employed in the economy or unemployed during the survey week [3]. Classification of economic activity was used to highlight the following categories of the population aged 15-72 years: • Economically active population (employed and unemployed); • Economically inactive population (scholarship holders, pensioners, persons receiving benefits except unemployment benefits, engaged in private farming, etc.); • Persons who have not indicated economic activity. Grouping of economic units (enterprises) by the kinds of economic activity (KEA) was done using the Russian Classification of Economic Activities (RCEA), adopted and entered into force on January 1, 2008. RCEA is based on harmonization with the official version in Russian of Statistical Classification of Economic Activities in the European Community (NACE Rev. 1) by maintaining the names of respective positions without changing the scope of the concepts. These are the following types of activities [12]: Table-1. Economic Activities Section | Economic Activities | А | AGRICULTURE, HUNTING AND FORESTRY | B | FISHING | С | MINING AND QUARRYING | D | MANUFACTURING | E | ELECTRICITY, GAS AND WATER SUPPLY | F | CONSTRUCTION | G | WHOLESALE AND RETAIL TRADE; REPAIR OF MOTOR VEHICLES, MOTORCYCLES AND PERSONAL AND HOUSEHOLD GOODS | H | HOTELS AND RESTAURANTS | I | TRANSPORT, STORAGE AND COMMUNICATION | J | FINANCIAL INTERMEDIATION | K | REAL ESTATE, RENTING AND BUSINESS ACTIVITIES | L | PUBLIC ADMINISTRATION AND DEFENCE; COMPULSORY SOCIAL SECURITY | M | EDUCATION | N | HEALTH AND SOCIAL WORK | O | OTHER COMMUNITY, SOCIAL AND PERSONAL SERVICE ACTIVITIES | P | ACTIVITIES OF HOUSEHOLDS | Q | EXTRA-TERRITORIAL ORGANIZATIONS AND BODIES |
During the sample survey of payroll, the number of organizations by professional groups and economic activities conducted on October 31, 2012 is identified by the following categories of staff: • Heads of organizations and their structural units (services); • Specialists of higher qualification; • Specialists of mid-level qualifications; • Employees engaged in the preparation of information, documentation, accounting and service; • Service workers, housing and communal services, trade and related activities; • Skilled workers in agriculture, forestry, hunting and fishery activities; • Skilled factory workers, construction, transport, communication, geology and exploration of mineral resources; • Operators, machinists of systems and machinery; • Unskilled workers. The above categories of staff were grouped into four groups to highlight four spheral classes or SPHERONS: 1. The heads of organizations and their structural units (services) - P3, Orgclass; 2. Specialists of higher and mid-level qualifications engaged learning and health care personnel - P1w, Socioclass; 3. Specialists and employees involved in preparation of information, documentation and accounting - P2, Infoclass; 4. Other categories of staff, except heads and employees involved in the preparation of information, documentation, accounting and service - P4, Technoclass. In this case, the category of employees engaged in the preparation of information, documentation, accounting and service groups include the following personnel: • Stenographers and typists; • Operators using special equipment for the preparation and transmission of information (printer, telex, facsimile, cryptographic equipment and e-mail); • Operators of computers (PCs), employed various information input; • Operators of computers (counting machines, calculators, texture machine); • Secretaries and clerks; • Employees engaged in accounting transactions and accounting; • Employees engaged in the processing of statistical and financial information; • Employees engaged in the receipt and delivery of goods; • Employees engaged in dispatching production. • Employees engaged in accounting and on duty transport; • Employees engaged in card files and libraries; • Coders, proofreaders and related occupations; • Other employees engaged in the preparation of information, documentation and accounting; • Cashiers, including tickets cashiers; • Cashiers of banks and related occupations; • Employees to obtain payments on accounts, overdue and other cash amounts; • Employees engaged in receiving and informing visitors (receptionists, attendants of pass office, on the issuance of certificates and others); This group includes the specialists of scientific and design organizations, cultural institutions, art, media, advertising and the like. Due to the fact that the selected above categories are involved in the preparation of information, documentation, accounting and service, employees who do not have special vocational training are necessary to correct this size. Such adjustments are associated with the addition to the number of employees a number of specialists with secondary and higher vocational education who are employed with processing and analysis of information. Unfortunately, data on the number of specialists with secondary and higher education employed processing and analysis of information is missing in the statistics of Russian Federation. 6. Technique of Definition of Number of Russia SPHERONS Based on Statistics The technique of determining the number of SPHERONS of employed (working, economically active) persons in Russia is a superposition and cumulative use of two traditional statistical classifications (KEA and categories of staff) on the structure of SPHERONS. Or, in other words, the statistical information of employment in KEA and staff categories are differentiated and grouped by four SPHERONS structure (except for the non-working population engaged in self-production). This technique can be expressed by the following table. Table-2. KEA by Personnel Categories Economic Activities (KEA) | Personnel Categories | P1w | P2 | P3 | P4 | Economic Activities, Table-1. | | | | |
Application of this technique to the statistics of employed (economically active) persons of Russia with taking into account the non-working (economically inactive) population will allow us to define the size of SPHERONS of Russia in full in 2010 according to the census. 7. Mid-year Population of the Russian Federation for 2010 Mid-year population of the Russian Federation for 2010 amounted to 142.938 million. This is calculated by the average chronological quarters of 2010. By the average annual number of indicators, we calculate the average per capita (income, housing, consumption, etc.). Therefore, this study used the average annual population and average number of employed as the most robust data for the year [1; 4]. 8. Definition of Number of Non-working Population (P1n) in Russia for 2010 The 2010 population census of the age and gender composition of the population living in private households identified the following age groups and calculated the structure of the non-working population employed in self-production [3; 7; 8; 9; 10; 11]: Table-3. Employed self-production (non-working, economic inactive), millions P1n | P1n = Employed self-production, sum of non-working, economic inactive: | 73,629 | 100% | | Age group 0-14 years: | 21,398 | 29,1 | | Age group 15-72 years, inactive: | 33,708 | 45,8 | | Age group 15-72 years, unemployed: | 6,647 | 9,0 | | Age group 15-72 years, the homeless: | 0,064 | 0,1 | | Age group 73 and older, inactive: | 9,979 | 13,6 | | Others: | 1,833 | 2,5 |
Calculated according to the RPC - 2010, Volume 7, Table 1, Population of private households by age groups, gender and economic activity [11]: http://www.gks.ru/free_doc/new_site/perepis2010/croc/perepis_itogi1612.htm 9. Number of SPHERONS in Russia for 2010 Table-4. Number of SPHERONS of Population in RUSSIA for 2010, in million people Spheral Indices | The Employed in Branches of Four Spheres | 2010 г. | % | P | All Population of Russia: P = P1+P2+P3+P4 | 142,938 | 100 | P1 | SOCIOCLASS:P1 = P1w + P1n | 84,988 | 59,4 | P1w | P1w = sum of employed (working) in the branches of Sociosphere: | 11,359 | 7,9 | | MEDUCATION | 5,109 | 3,6 | | NHEALTH AND SOCIAL WORK | 4,203 | 2,9 | | OOTHER COMMUNITY, SOCIAL AND PERSONAL SERVICE ACTIVITIES | 2,046 | 1,4 | P1n | P1n = Employed of self-production, sum of non-working, economic inactive: | 73,629 | 51,5 | | Age group 0-14 years: | 21,398 | 15,0 | | Age group 15-72 years, inactive: | 33,708 | 23,6 | | Age group 15-72 years, unemployed: | 6,647 | 4,6 | | Age group 15-72 years, the homeless: | 0,064 | 0,0 | | Age group 73 and older, inactive: | 9,979 | 7,0 | | Others: | 1,833 | 1,3 | P2 | INFOCLASS = sum of employed in the branches of Infosphere: | 3,997 | 2,8 | | COMMUNICATION | 0,721 | 0,5 | | Science and scientific services | 0,755 | 0,5 | | Others | 2,521 | 1,8 | P3 | ORGCLASS = sum of employed in the branches of Orgsphere: | 10,775 | 7,5 | | LPUBLIC ADMINISTRATION AND DEFENCE; COMPULSORY SOCIAL SECURITY | 1,122 | 0,8 | | JFINANCIAL INTERMEDIATION | 3,905 | 2,7 | | Others: | 5,748 | 4,0 | P4 | TECHNOCLASS = sum of employed* in the branches of Technosphere**: | 40,930 | 28,6 | | АAGRICULTURE, HUNTING AND FORESTRY | 6,063 | 4,2 | | BFISHING | 0,130 | 0,1 | | СMINING AND QUARRYING | 0,930 | 0,7 | | DMANUFACTURING | 8,926 | 6,2 | | EELECTRICITY, GAS AND WATER SUPPLY | 1,656 | 1,2 | | FCONSTRUCTION | 4,751 | 3,3 | | GWHOLESALE AND RETAIL TRADE; REPAIR OF MOTOR VEHICLES, MOTORCYCLES AND PERSONAL AND HOUSEHOLD GOODS | 9,882 | 6,9 | | HHOTELS AND RESTAURANTS | 1,011 | 0,7 | | ITRANSPORT AND STORAGE | 3,886 | 2,7 | | KREAL ESTATE, RENTING AND BUSINESS ACTIVITIES | 3,695 | 2,6 | | Statistical error | 2,248 | 1,6 |
Total in Table-1 are 32 indices + statistical error. * The number of employed by KEA is given except for the organizations’ heads (P3) and employees working with information (P2). ** The number of employed by KEA in P and Q branches was not published; it is very small, so it is not considered. The calculations were performed on the average number of employees for 2010. Note. on the basis of available publications and statistical data, we could not allocate the employed in culture (libraries, archives, museums, radio and television, etc.) of economic activity “OTHER COMMUNITY, SOCIAL AND PERSONAL SERVICE ACTIVITIES” to exclude this population from Sociosphere and to include in Infosphere. 10. Number of SPHERONS in Russia for 1991 and 1996 For comparison, we publish a similar table of SPHERONS of Russian population for 1991 and 1996, made in other state statistical classification of economic activities and published in 2002 [5, 71-72]. Table-5. Number of SPHERONS in Russia for 1991 and 1996 in million people Spheral Indices | The Employed in Branches of Four Spheres | 1991 г. | 1996 г. | 1996/% | P | All Population of Russia: P = P1+P2+P3+P4 | 148,5 | 148 | 100 | P1 | SOCIOCLASS:P1 = P1w + P1n | 81,6 | 89,1 | 60,2 | P1w | P1w = sum of employed (working) in the branches of Sociosphere: | 6,8 | 7,1 | 4,8 | | Education | 2,5 | 2,5 | 1,7 | | Health, social welfare, sports | 4,3 | 4,6 | 3,1 | | Priests | - | - | - | P1n | P1n = Employed of self-production, sum of non-working, economic inactive: | 74,8 | 82,0 | 55,4 | | Pensioners, invalids | 33,8 | 37,1 | 25,1 | | Pupils, students (full time) | 25,5 | 26,6 | 18,0 | | Preschoolers and housewives | 11,8 | 11,5 | 7,8 | | Unemployed | 3,6 | 6,8 | 4,6 | P2 | INFOCLASS = sum of employed in the branches of Infosphere: | 8,5 | 7,4 | 5,0 | | Science and scientific service | 0,9 | 0,9 | 0,6 | | Communication | 2,8 | 1,6 | 1,1 | | Culture and art | 4,8 | 4,9 | 3,3 | P3 | ORGCLASS = sum of employed in the branches of Orgsphere: | 4,0 | 4,6 | 3,1 | | Number of the management staff | 1,7 | 1,9 | 1,3 | | Finance, credit, insurance | 0,4 | 0,9 | 0,6 | | Other branches (defence, policy, security, custom-house etc.) | 1,9 | 1,8 | 1,2 | P4 | TECHNOCLASS = sum of employed in the branches of Technosphere: | 54,4 | 46,9 | 31,7 | | Industry | 22,4 | 16,3 | 11,0 | | Agriculture and wood industry | 9,8 | 9,8 | 6,6 | | Construction | 8,5 | 6,3 | 4,3 | | Transport | 4,9 | 4,4 | 3,0 | | Trade and public nutrition | 5,6 | 6,8 | 4,6 | | Housing and communal services | 3,2 | 3,3 | 2,2 |
11. Conclusion: Problems and Significance of the Study The problems of this statistical study are caused by its novelty (nobody has conducted similar studies) and its colossal labor input. These problems become apparent when expanding the content of research, for example, as proposed in its Program (below), including an analysis of the economic situation of SPHERONS, their income, their participation in government, their education and, similarly, their qualities in dynamics for years, in different countries and at different levels from municipal to global, starting from schools, hospitals, small businesses and settlements to large corporations, cities and countries. The significance of this study is difficult to overestimate. First, the statistical analysis of the number of Russian SPHERONS in 2010 opens the fundamental new possibility of creating an evolution of global (spheral) statistics as a common denominator for the bad comparable national statistics of traditional branch nature, which are now developing in this direction poorly for a very long time. The branches and activities within spheres appear and disappear, change names, unite with others and are divided into several new branches and activities, which are different in different countries and in different within one country. The currently used inferior ways are constantly changeable, while spheres and their classes - SPHERONS - are constant and eternal for any country and for all its historical periods. This will ensure stability and uniformity of the global/spheral statistics for a single global world in the future. Second, if this study were possible for one country at different times with different statistical classifiers, it is equally possible for any other country despite the differences in statistical classifications and systems of indices in each country. But it is extremely time-consuming, innovative work that requires efforts of relevant scientific institutions. Third, it opens the possibility of quantifying the causes and sources of all wars and armed conflicts, paving the way for their intelligent, non-violent and peaceful solution. Global/spheral statistics are an essential element of global peace science (GPS), without which it cannot exist. In place of baseless and eternal accusations by warring parties, the SPHERONS method is able to put accurate, statistical assessment of the scale of mutual contradictions and disharmony and indicate ways to eliminate or minimize them for beneficial mutual interests. Fourth, development of other social sciences depends on the global/spheral statistics of SPHERONS; for example, forecasting, without which “the future loses certainty” and humanity is deprived of scientific wisdom. Academicians Viktor Sadovnichiy and Daisaku Ikeda present this idea. In particular, they wrote: “Today, the mathematical theory of forecasting (which is inseparable from statistics – O.K. and L.S.) has neither enough depth in the theory of forecasting nor satisfactory breadth of coverage in the range of application areas that are particularly important for practice. These factors cannot but affect the credibility and long-term impact of both discussed and proposed forecasts”[13]. The scientific theory of social harmony, presented in the ABC of Harmony and crystallized in its social genome SOCIONOME, together with the global social structure of SPHERONS and global/spheral statistics, is “deep theory of forecasting.” They provide credibility, long-term and worldwide forecasting but require the development of new mathematics of harmony and global statistics, which are suitable to express and calculate the spheral elements of social harmony, especially its source - SPHERONS. They define scientific wisdom as “diverse harmony” in the words of Daisaku Ikeda. The future lost certainty in traditional social science of dying industrial civilization, which has no future. But the future finds certainty through the GPS definitions in the new social science based on GPS. This future is a harmonious civilization of SPHERONS, conscious/scientific global peace without wars, conservation of nature, economic and political equality, justice and love. Fifth, most importantly, this study as a statistical proof of SPHERONS in only one country - in Russia - and it is minimal. But for a start, it is enough to convince us in their universal existence and objective reality as eternal actors of global peace from harmony. The subsequent similar studies in other countries will confirm this conclusion. References: 1. Regions of Russia. Socio-economic Indicators 2013. Statistical Collection. M: 2013 2. Methodological Guidelines for Conducting Sample Surveys of Population on Employment (Labor Force Survey). M: 2010: http://www.gks.ru/free_doc/new_site/population/trud/Untitled452-10.pdf 3. Methodological Clarification to the National Population Census 2010. M: 2010 4. Statistical Yearbook of Russia 2013. -M: 2014 5. Semashko Leo (2002). Tetrasociology: Responses to Challenges. -St Petersburg 6. Semashko Leo and GHA 75 coauthors (2012). The ABC of Harmony for World Peace....- Delhi 7. Russian Census of Population 2010 8. Volume 1 Number and Distribution of the Population 9. Volume 2 Age and Sex Composition and Marital Status 10. Volume 6 The Size and Composition of Households 11. Volume 7 The economic Active and Inactive Population 12. The National Classifier of Economic Activities OK 029-2007 (NACE Rev. 1.1). -M.: 2012 13. Sadovnichiy Victor, Ikeda Daisaku (2013). At the Turn of the Century. Dialogue on the Essentials— Moscow: Moscow University Press Olga Kashina, Ph.D. (Statistics), Professor, State Educational University, Graduated the Leningrad Finance and Economics Institute in 1976, specialty “Statistics.” In 1982 doctoral thesis of economic sciences on statistics. Teaching statistics in universities since 1977. Published more than 70 scientific works, including co-authorship of three textbooks for high schools on statistics. Expert of Rosstat in St. Petersburg and Leningrad region (Petrostat). Home address: St. Petersburg, Russia, Email: olgkash2007@rambler.ru Leo Semashko, Ph.D. (Philosophy), Founding President, Global Harmony Association (GHA) since 2005; State Councilor of St. Petersburg; Philosopher, Sociologist and Peacemaker from Harmony; Author of more than 300 scientific publications, including 16 books and brochures in 12 languages; Director: Tetrasociology Public Institute, Russia; Director, GHA Website “Peace from Harmony”: www.peacefromharmony.org; Editor in Chief, The ABC of Harmony for World Peace .. (www.peacefromharmony.org/?cat=en_c&key=478) by 76 co-authors from 26 countries, for which the GHA was recognized as one of candidates for the Nobel Peace Prize 2013; Home address: St. Petersburg, Russia, Phone: 7 (812) 597-65-71, E-mail: leo.semashko@gmail.com, 2.2. Statistics of SPHERONS of St. Petersburg in 2010: Number. Olga Kashina This study repeats the methodology, contents and sources (references) of previous study of SPHERONS of Russia (above), therefore here we will restrict only the table of SPHERONS of population in St. Petersburg in 2010. The calculations were based on the published data of Russian Census of Population (RCP) 2010 in St. Petersburg [1] on the mid-year number of population of St. Petersburg in 2010, which amounted 4866.1 thousand people and mid-year number of employees in city’s enterprises - 2466.3 thousand people. On materials of RCP 2010 in St. Petersburg were used the groupings of the population by types of households, age groups and economic activity [9; 10; 11] to determine the number of unemployed (non-working) people within Socioclass. Table. Number of SPHERONS of St-Petersburg for 2010, in thousand people Spheral Indices | The Employed in Branches of Four Spheres | 2010 г. | % | P | All Population of St-Petersburg: P = P1+P2+P3+P4 | 4866,1 | 100 | P1 | SOCIOCLASS:P1 = P1w + P1n | 2533,1 | 52,1 | P1w | P1w = sum of employed (working) in the branches of Sociosphere: M, N, O | 480,2 | | P1n | P1n = Employed of self-production, sum of non-working, economic inactive: | 2052,9 | | P2 | INFOCLASS = sum of employed in the branches of Infosphere: | 349,2 | 7,2 | P3 | ORGCLASS = sum of employed in the branches of Orgsphere: | 410,7 | 8,4 | P4 | TECHNOCLASS = sum of employed in the branches of Technosphere: A-K | 1225,8 | 25,2 | | Statistical error | 347,3 | 7,1 |
Olga Kashina, Ph.D. (Statistics), Professor, State Educational University, St. Petersburg 2.3. Statistics of SPHERONS of India in 2010: Sources and Number The Table of SPHERONS of India, bibliography and brief commentary: 5-10 pages, no more. Will be published later 2.4. Statistics of SPHERONS of USA in 2010: Sources and Number The Table of SPHERONS of USA, bibliography and brief commentary: 5-10 pages, no more. Will be published later 2.5. Statistics of SPHERONS of Germany in 2010: Sources and Number The Table of SPHERONS of Germany, bibliography and brief commentary: 5-10 pages, no more. Will be published later 2.6. Statistical Study of SPHERONS of Educational Institutions. Svetlana Kuskovskaya, Habyarimana Heli, Maitreyee Roy, Maria Azcona, Leela Pradhan In the first chapter was established universality of SPHERONS as a global social structure at all levels, starting with the smallest enterprises and schools. This is confirmed by a few simple statistical studies of spheral classes in several schools and colleges of different countries: Russia, Rwanda, India, Argentina and Nepal. We publish below the results of these studies in the form of the authors’ reports represented in comparable tables. All studies presented below have one common title under which they are placed. They differ only by the authors, country and number of SPHERONS. Sociological Statistical Study (SSS) of Dynamics of Global Social Structure (Four Harmonious Spheral Classes of the Population - SPHERONS) at Level of: Municipal Educational Budget Institution:
Novoladozhskaya Secondary School number 2,
School Address: town of Novaya Ladoga, Leningrad Street, Building 2
Volkhov district, Leningrad region, Russia
Author:
Svetlana Kuskovskaya, a primary school teacher. My work experience at this school is 28 years. Home address: Novaya Ladoga, tel. +79052868550
Email: svetlana-5506@bk.ru
Table. Dynamics of our School SPHERONS (Spheral Classes) since 2000 to 2013, in persons Spheral indices | The employed | 2000 | 2005 | 2010 | 2013 | P | All People in my School: P =P1 +P2 +P3 +P4 | 917 | 896 | 405 | 402 | P1 | Socioclass: P1 = P1w + P1s | 871 | 854 | 383 | 380 | P1w | P1w = sum of the employed in branches of sociosphere: | 85 | 82 | 38 | 33 | | Education – Teachers number | 84 | 81 | 38 | 33 | | Health – Medical Staff number | 1 | 1 | - | - | P1s | P1s = Students number | 796 | 772 | 345 | 347 | P2 | Infoclass = sum of the employed in branches of infosphere: | 7 | 6 | 5 | 5 | | Librarians number | 2 | 1 | 1 | 1 | | Bookkeeping number | 2 | 2 | 1 | 1 | | Other information service number: Secretary, laboratorian | 3 | 3 | 3 | 3 | P3 | Orgclass = sum of the employed in branches of orgsphere: | 10 | 10 | 7 | 7 | | Management staff of School at all levels | 6 | 6 | 5 | 5 | | Lawyers | - | - | - | - | | Security | 4 | 4 | 2 | 2 | P4 | Technoclass = Technical staff number: supply manager, electrician, mechanic, cleaning ladies, more | 29 | 26 | 10 | 10 |
Date: February 5, 2014 Notes. The number of pupils in our school for these years decreased for several reasons:
1. Demographics: falling birth rate in our region;
2. Economic: several companies closed in our town;
3. Migration: young people are leaving the city St. Petersburg. At the same time, there was a reduction of school staff, with many staff positions eliminated: speech therapist, psychologist, and others; nurse is listed in the hospital. Conclusion: This study shows that the school can work successfully only in harmony, i.e. in coordinated interaction of its four SPHERONS (spheral classes), every from which is interested in it and supports their harmony from which follows peace ensuring a normal work environment and life of the school. Absence of harmony is fraught with failures of the school work and its disorganization. The absence of any one of these classes and disharmony between them mean that the workings of the school are impossible. Svetlana Kuskovskaya Institute of Agriculture, Technology and Education of Kibungo (INATEK), Kibungo-Rwanda. Author: Mr. Habyarimana Heli, Director of the Office of the Rector, P.O.Box 06 Kibungo-Rwanda, haheli2001@yahoo.fr, (+250)0788686324 Table: Dynamics of SPHERONS (Spheral Classes) in INATEK in persons since 2000 to 2013 Spheral indices | The employed | 2000 | 2005 | 2010 | 2013 | P | All People in INATEK: P =P1 +P2 +P3 +P4 | N/A | 1381 | 3340 | 3958 | P1 | Socioclass, P1 = P1w + P1s | N/A | 1343 | 3275 | 3879 | P1w | P1w = sum of the employed in branches of sociosphere: | N/A | 76 | 86 | 100 | | Education – Teachers number | N/A | 76 | 86 | 100 | | Health – Medical Staff number | N/A | 0 | 0 | 0 | P1s | P1s = Students number | N/A | 1267 | 3189 | 3779 | P2 | Infoclass = sum of the employed in branches of infosphere: | N/A | 2 | 6 | 7 | | Librarians number | N/A | 2 | 4 | 4 | | Bookkeeping number | N/A | 0 | 1 | 1 | | Other information service number | N/A | 0 | 1 | 2 | P3 | Orgclass = sum of the employed in branches of orgsphere: | N/A | 11 | 15 | 21 | | Management staff of INATEK at all levels | N/A | 5 | 8 | 12 | | Lawyers | N/A | 0 | 1 | 1 | | Security | N/A | 6 | 6 | 7 | P4 | Technoclass = Technical staff number: supply manager, electrician, mechanic, cleaning ladies, more | N/A | 25 | 44 | 51 |
Date: April 7, 2014 N/A: Not applicable (INATEK was created in 2003). Conclusion: This study shows, INATEK can work successfully only in harmony, i.e. in coordinated interaction of its four SPHERONS (spheral classes), every from which is interested in it and support their harmony from which follows peace ensuring a normal work environment and life of INATEK. The absence of harmony is fraught with failures of the INATEK work and its disorganization. The absence of any one of these classes and disharmony between them mean that INATEK workings are impossible. In the absence at least one of these classes and harmony between them work of INATEK is impossible. Mr. Habyarimana Heli BASANTI DEVI COLLEGE, KOLKATA, INDIA, ESTD: 1959 Author: Dr. Maitreyee Bardhan Roy, Principal, Kolkata, India, maitreyee25@rediffmail.com Table: Dynamics of SPHERONS (Spheral Classes) in this College in individuals since 2000 to 2013 Spheral indices | The employed | 2000 | 2005 | 2010 | 2013 | P | All People in College: P =P1 +P2 +P3 +P4 | 761 | 980 | 1136 | 1206 | P1 | Socioclass, P1 = P1w + P1s | 752 | 970 | 1121 | 1188 | P1w | P1w = sum of the employed in branches of sociosphere: | 37 | 42 | 49 | 54 | | Education – Teachers number | 37 | 42 | 49 | 54 | | +Health – Medical Staff number | 0 | 0 | 0 | 0 | P1s | P1s = Students number | 715 | 928 | 1072 | 1134 | P2 | Infoclass = sum of the employed in branches of infosphere: | 3 | 3 | 3 | 3 | | Librarians number | 0 | 1 | 1 | 1 | | +Bookkeeping number | 1 | 2 | 2 | 2 | | +Other information service number(Lab Instructor ) | 2 | 0 | 0 | 0 | P3 | Orgclass = sum of the employed in branches of orgsphere: | 3 | 4 | 5 | 6 | | Management staff of Colloge at all levels | 2 | 3 | 3 | 3 | | +Lawyers | hired | 0 | 0 | 0 | | +Security | 1 | 1 | 2 | 3 | P4 | Technoclass = Technical staff number: supply manager, electrician, mechanic, cleaning ladies, more | 3 Electrician-1 Mechanic-1 Cleaning Ladies=1 | 3 1 1 1 | 7 1 1 2 3 | 9 1 1 3 4 |
Date: March 31, 2014 The Table includes in the total 15 indices, for four years – 60 statistical data. The SSS task of any educational institution for each country is the same. only the identity of statistics provides their full-scale internal comparability within them and across countries and regions. The SSS report for each educational institution in each country is limited by four years: 2000, 2005, 2010 and 2013, and is expressed as a single complex of 7 spheral indices and 10 branch indices, from which the spheral indices are made. The spheral indicators P1s and P4 are identical to the branch indices. Total is 15 indices. The report is limited by this Table that makes it available to any teacher. Conclusion: This study shows, our College can work successfully only in harmony, i.e. in coordinated interaction of its four SPHERONS (spheral classes), every from which is interested in it and support their harmony from which follows peace ensuring a normal work environment and life of the College. Absence of harmony is fraught with failures of the College work and its disorganization. The absence of any one of these classes and disharmony between them mean that the workings of the College are impossible. Dr. Maitreyee Bardhan Roy Bulnes Private Educational Experimental Institute, approved by the City Government to help pupils with different kind of learning disabilities, Buenos Aires, Argentine Author: MARIA CRISTINA AZCONA, Educational Psychologist and familiar counselor in this Institute, Buenos Aires, Argentine, mcrisazcona@gmail.com Table: SPHERONS (Spheral Classes) in Bulnes Institutefor 2010 Spheral indices | The employed | 2000 | 2005 | 2010 | P | All People in the Institute: P =P1 +P2 +P3 +P4 | | | 154=134+13+3+4 | P1 | Socioclass, P1 = P1w + P1s | | | 134 | P1w | P1w = sum of the employed in branches of sociosphere: | | | 14 | | Education – Professors number | | | 12 | | Health – educational psychologists | | | 2 | P1s | P1s = Students/pupils number | | | 120 | P2 | Infoclass = sum of the employed in branches of infosphere: | | | 13 | | Librarians number | | | - | | A Systems expert and accountant | | | 2 | | Secretary, | | | 11 | P3 | Orgclass = sum of the employed in branches of orgsphere: | | | 3 | | Management staff of Institute at all levels | | | 2 | | Lawyers | | | 1 | | Security | | | - | P4 | Technoclass = Technical staff number: supply manager, electrician, mechanic, cleaning ladies, more | | | 4 |
March 27, 2014 Conclusion: This study shows, Bulnes Institute can work successfully only in harmony, i.e. in coordinated interaction of its four SPHERONS (spheral classes), every from which is interested in it and support their harmony from which follows peace ensuring normal work and life. Absence of harmony is fraught with failures of the Bulnes Institute work and its disorganization. The absence of any one of these classes and disharmony between them mean that the workings of Bulnes Institute are impossible. Maria Cristina Azcona Faculty of Education, Sano Thimi Campus, University of Katmandu, Nepal Address: Katmandu, Nepal Author: Professor of Sociology of this University Leela Pradhan. My work Experience is 39 years. Email: leelaprd@hotmail.com Table: Dynamics of SPHERONS (Spheral Classes) on Faculty of Education in individuals since 2000 to 2013 Spheral indices | The employed | 2000 | 2005 | 2010 | 2013 | P | All People on the Faculty: P =P1 +P2 +P3 +P4 | 1301 | 718 | 760 | 841 | P1 | Socioclass, P1 = P1w + P1s | 1270 | 686 | 726 | 806 | P1w | P1w = sum of the employed in branches of sociosphere: | 83 | 96 | 106 | 121 | | Education – Teachers number | 82 | 95 | 105 | 120 | | Health – Medical Staff number | 1 | 1 | 1 | 1 | P1s | P1s = Students number | 1187 | 590 | 620 | 685 | P2 | Infoclass = sum of the employed in branches of infosphere: | 6 | 7 | 9 | 10 | | Librarians number | 1 | 1 | 1 | 1 | | Bookkeeping number | 2 | 2 | 4 | 5 | | Other information service number | 3 | 4 | 4 | 4 | P3 | Orgclass = sum of the employed in branches of orgsphere: | 13 | 13 | 13 | 13 | | Management staff of BEI at all levels | 4 | 4 | 4 | 4 | | Lawyers | 1 | 1 | 1 | 1 | | Security | 8 | 8 | 8 | 8 | P4 | Technoclass = Technical staff number: supply manager, electrician, mechanic, cleaning ladies, more | 12 | 12 | 12 | 12 |
Date: April 11, 2014 Conclusion: This study shows, our Faculty of Education can work successfully only in harmony, i.e. in coordinated interaction of its four SPHERONS (spheral classes), every from which is interested in it and support their harmony from which follows peace ensuring normal work and life on Faculty. Absence of harmony is fraught with failures of our Faculty work and its disorganization. The absence of any one of these classes and disharmony between them mean that the workings of Faculty are impossible. Prof. Leela Pradhan
The University of El Oued Address: Cite Dhahraouia-BP 215, Guemar 39002, Algeria Author: Ammar Banni, Professor of Education in this University, ammarbanni@yahoo.fr Table. Dynamics of SPHERONS in the University in persons since 2005 to 2013 Spheral indices | The employed | 2005 | 2010 | 2013 | P | All People in University: P =P1 +P2 +P3 +P4 | 400 | 1830 | 2897 | P1 | Socioclass, P1 = P1w + P1s | 344 | 1749 | 2804 | P1w | P1w = sum of the employed in branches of Sociosphere: | 20 | 69 | 84 | | Education – Teachers number | 20 | 69 | 84 | | Health – Medical Staff number | 00 | 00 | 00 | P1s | P1s = Students number | 324 | 1680 | 2720 | P2 | Infoclass = sum of the employed in branches of Infosphere: | 03 | 06 | 07 | | Librarians number | 02 | 04 | 05 | | Bookkeeping number | | | | | Other:student unions | 01 | 02 | 02 | P3 | Orgclass = sum of the employed in branches of Orgsphere: | 26 | 40 | 46 | | Management staff of BEI at all levels | 15 | 19 | 20 | | Lawyers | 01 | 01 | 01 | | Security | 10 | 20 | 25 | P4 | Technoclass = Technical staff number: supply manager, electrician, mechanic,cleaning ladies, more | 27 | 35 | 40 |
May 15, 2014 Note. The University of El Oued, before 2005, was an adjunct university center of the University of Kasdi Merbah Ouargla. Since 2005, the University of El Oued was officially inaugurated and open from 3 faculties in 3 different places. Currently it contains 5 Faculties and one College of Human Sciences and Education: Ahmed Arbia College where I worked until the end of 2013. Conclusion: This study shows, our University can work successfully only in harmony, i.e. in coordinated interaction of its four SPHERONS (spheral classes), every from which is interested in it and support their harmony from which follows peace ensuring its normal work and life. Absence of harmony is fraught with failures of the University work and its disorganization. In the absence at least one of these classes and harmony between them work of University is impossible. Prof. Ammar Banni These and similar studies of any companies, organizations, institutions, communities, cities and countries scientifically prove a reality, universality, necessity and sufficiency of the global social structure of spheral harmonious classes, SPHERONS, providing peace from their harmony at all levels from local to global as the first condition of life activity of humanity and every individual.
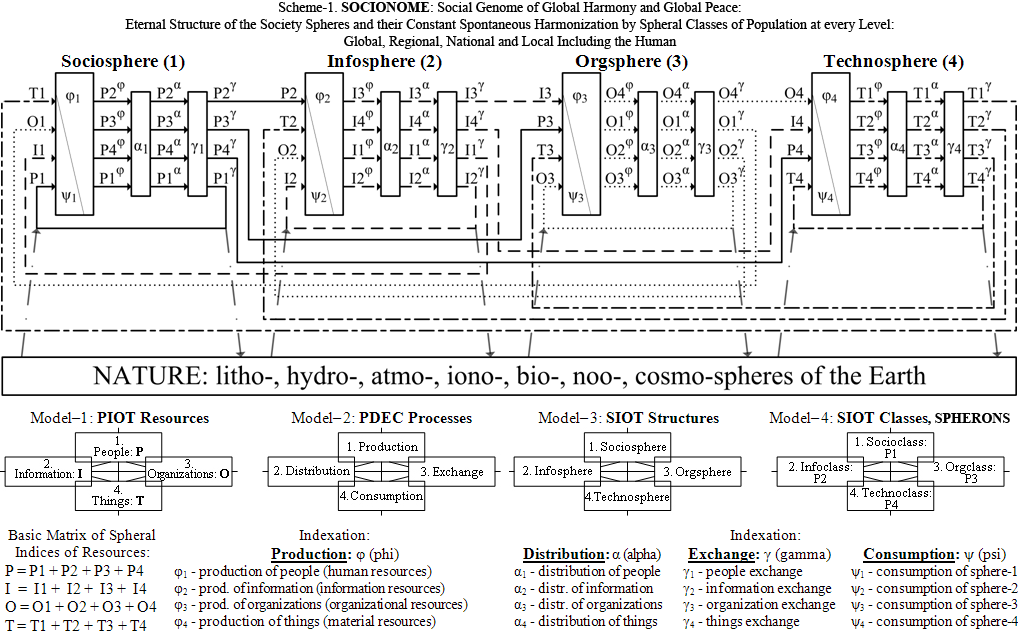
2.7. Monitoring: Dynamics of Peace and War Priorities in World Public Consciousness in 2014. Leo Semashko, Ivan Ivanov Monitoring of the Internet Data at GOOGLE, Quarterly since 2014, in English and Russian Languages, in Four World's Spheres (SIOT), within the SOCIONOME (Social Genome) Paradigm of Global Peace Science (GPS) The Feast in Time of Military Plague?* * John Wilson (1785-1854), the famous Scottish writer, poet and philosopher wrote the play: The city of the plague, dedicated to the London plague of 1665. Alexander Pushkin (1799-1837), the great Russian poet created in this spirit a little tragedy "The feast in time of the plague" in 1830, dedicated to the cholera epidemic. Today, we should ask about the military epidemic of humanity: The feast in time of the military plague? Our monitoring, which focuses on the diagnosis of global military pathology, answers to this question. SOCIONOME Scheme: SOCIONOME: Social Genome of Global Harmony and Global Peace: Eternal Structure of the Society Spheres and their Constant Spontaneous Harmonization by Spheral Classes of Population at every Level: Global, Regional, National and Local Including the Human that Provides Natural Global Peace and its Objective Priority
Details about SOCIONOME look here: 1. The ABC of Harmony for World Peace ... 2012:www.peacefromharmony.org/?cat=en_c&key=585 2. Video, 8 minutes:http://youtu.be/hbxY5lREOeA GHA 49th Project Started: December 26, 2013 Approved by GHA: January 17, 2014 Authors: Project Manager is Dr. Leo Semashko – Russia, Moderator is Ivan Ivanov, and coauthors are 40 GHA members: Daurenbek Aubakir, Julia Budnikova, Savita Srivastava, Nicolae Bulz, Leela Pradhan, Raissa Kaziyeva, Madhu Krishan, Uraz Baimuratov, Marie Robert, Bishnu Pathak, Muhammad Khan, Igor Shadkhan, Ernesto Kahan, María Cristina Azcona, Ayo Ayoola-Amale, Alexander Semashko, Vera Popovich, Charles Mercieca, Andrew Semashko, Svetlana Vetrova, Piotr Semashko, Svetlana Kuskovskaya, Surendra Pathak, Roxana Sadykova, Susana Roberts, Hedva Bachrach, Marianna Poghosyan, Guy Creque, Adolf Shvedchikov, Maitreyee Roy, Matjaž Mulej, Apostolos Paschos, Athanassios Koumouris, Takis Ioannides, Celia Altschuler, Lida Sherafatmand, Dmitry Delyukin, from 16 countries: Argentina, Armenia, Ghana, Greece, India, Israel, Kazakhstan, Malta, Nepal, Pakistan, Puerto Rico, Romania, Russia, Slovenia, France and the United States. Copyright © 2014 Global Harmony Association Copyright © 2014 Leo Semashko Abstract The proposed monitoring is created by GHA in the process and within of formation of the Global Peace Science (GPS) as its organic part and one of the paragraphs of this book. But monitoring also possesses independent scientific and practical importance. Monitoring the dynamics of peace and war priorities in the world public consciousness/opinion is a unique, innovative and high-tech tool of GPS with wider social designation and application similar to other peacekeeping instruments: Global Peace Index, Happy Planet Index, and etc. The unique scientific and social importance of monitoring is defined the fact that the subject of its research on the basis of theory of global harmony in "the ABC of Harmony" (2012) is the source of war and peace - human consciousness, from which, as defined by the UN and UNESCO documents, begins any war and peace. No one science explores the dynamics of its peaceful and military trends. Therefore, our monitoring, which measures the proportion of the war and peace priorities in the world public opinion by quarters of 2014 is an irreplaceable barometer of objective trends of their increase and decrease depending on the state of global social atmosphere. Of course, our monitoring, making just the first step in its life has already identified a threatening growing priority of military plague in public consciousness but this monitoring is very far from perfection and has many lacks, which will be overcome with time during its wide practical application and scientific development. Publication: In English: www.peacefromharmony.org/?cat=en_c&key=588 In Russian: www.peacefromharmony.org/?cat=ru_c&key=610 Table: Monitoring of Peace and War Priorities in the GPS SOCIONOME Paradigm through determining the frequency of their terms in GOOGLE Notes to the monitoring table as its rules 1. For each term in the table the unit of measure is millions (m) of uses, which GOOGLE shows and which are rounded to the third decimal place, i.e. to thousands. In the table are the following notations: 0 - is meaning that the search query is not found any pages. 0+ - means that the number of search results is less than 1,000. 0* - means that the search query was found only one page - page of monitoring site: http://peacefromharmony.org/ 2. The quantitative data are presented in two versions for each numbered position / line of tables: a) the broadest but least accurate, and b) the most narrow but the most accurate - these figures are expressed in quotes: "". In version a) the request is entered in GOOGLE in the usual format: the query words are separated by spaces. For example: peaceful people. In version b) the request is entered in GOOGLE in quotes. For example: "peaceful people."
№ | WAR, MILITARY | 01/01 | 04/01 | 07/01 | 10/01 | PEACE, PEACEFUL | 01/01 | 04/01 | 07/01 | 10/01 | World SOCIOSPHERE (Sphere-1) | 1 | War | 499 | 541 | 500 | 310 | Peace | 186 | 198 | 153 | 116 | "498" | "541" | "500" | "309" | "187" | "182" | "184" | "150" | 2 | Disharmony as cause of war | 3,48 | 3,23 | 3,08 | 3,53 | Harmony as cause of peace | 40,4 | 41,3 | 207 | 222 | "0" | "0*" | "0*" | "0*" | "0" | "0*" | "0*" | "0*" | 3 | Global world war | 833 | 1020 | 373 | 73,3 | Global world peace | 388 | 358 | 114 | 9,07 | "1,7" | "1,72" | "1,22" | "1,37" | "0,29" | "2,67" | "0,283" | "0,267" | 4 | Inevitability of war | 2,9 | 2,88 | 2,65 | 2,75 | Inevitability of peace | 1,7 | 1,7 | 1,25 | 1,23 | "0,275" | "0,257" | "0,244" | "0,269" | "0,03" | "0,03" | "0,055" | "0,182" | 5 | Military people | 947 | 1430 | 168 | 10,6 | Peaceful people | 266 | 264 | 24,3 | 23,7 | "0,391" | "1,94" | "1,15" | "1,08" | "1,6" | "1,5" | "1,09" | "1,13" | 6 | Military education | 782 | 817 | 165 | 10,9 | Peaceful education | 56 | 56,2 | 39,5 | 467 | "1,34" | "1,83" | "1,21" | "1,32" | "0,047" | "0,006" | "0,006" | "0,006" | 7 | Military upbringing | 3,07 | 4,17 | 2,5 | 2 | Peaceful upbringing | 8,24 | 8,13 | 7,58 | 0,9 | "0,058" | "0,01" | "0,012" | "0,012" | "0,006" | "0,005" | "0,005" | "0,004" | 8 | Military medicine | 136 | 127 | 32,2 | 2,35 | Peaceful medicine | 13,3 | 19,5 | 8,64 | 7,77 | "1,55" | "2,14" | "1,49" | "0,946" | "0,011" | "0,012" | "0,012" | "0,013" | 9 | Military games | 252 | 305 | 151 | 149 | Peaceful games | 60,5 | 44,7 | 33,2 | 29,6 | "0,380" | "0,476" | "0,361" | "0,413" | "0,04" | "0,006" | "0,008" | "0,007" | 10 | Military mood | 71,1 | 57,8 | 37,5 | 38,6 | Peaceful mood | 19,9 | 13,8 | 7,84 | 7,87 | "0,010" | "0,01" | "0,012" | "0,012" | "0,161" | "0,198" | "0,166" | "0,176" | | TOTAL for Sphere-1 | 3529,55 | 4308,08 | 1434,93 | 603,03 | | 1040,04 | 1005,33 | 596,31 | 885,14 | "503,704" | "549,383" | "505,699" | "314,422" | "189,185" | "186,427" | "185,625" | "151,785" | World INFOSPHERE (Sphere-2) | 11 | Military information | 670 | 854 | 167 | 16,3 | Peace information | 727 | 651 | 629 | 473 | "1,3" | "0,407" | "0,908" | "0,955" | "0,095" | "0,077" | "0,05" | "0,045" | 12 | War philosophy | 189 | 166 | 117 | 54 | Peace Philosophy | 90,8 | 96,3 | 48,5 | 74,9 | "0,033" | "0,034" | "0,1" | "0,051" | "0,165" | "0,165" | "0,16" | "0,155" | 13 | Military science | 805 | 865 | 160 | 6,98 | Peace science | 859 | 555 | 384 | 347 | "0,782" | "0,913" | "0,741" | "0,877" | "0,099" | "0,099" | "0,099" | "0,102" | 14 | World war science | 1650 | 1410 | 392 | 88 | World peace science | 662 | 520 | 332 | 382 | "1,91" | "1,79" | "1,65" | "1,45" | "0,269" | "0,224" | "0,202" | "0,082" | 15 | Military studies | 119 | 157 | 45,6 | 1,62 | Peace studies | 91,5 | 103 | 23,8 | 3,13 | "0,372" | "0,407" | "0,32" | "0,355" | "0,577" | "0,677" | "0,668" | "0,759" | 16 | Military strategy | 161 | 142 | 31,7 | 1,75 | Peaceful strategy | 24,1 | 35,4 | 15 | 42,2 | "0,536" | "0,524" | "0,531" | "0,678" | "0,008" | "0,007" | "0,008" | "0,008" | 17 | Military doctrine | 9,15 | 13,6 | 5,75 | 0,793 | Peaceful doctrine | 5,53 | 8,03 | 5,17 | 4,98 | "0,603" | "0,762" | "0,606" | "0,679" | "0,004" | "0,003" | "0,004" | "0,003" | 18 | Military purposes | 389 | 441 | 82,1 | 214 | Peace purposes | 307 | 300 | 52,9 | 132 | "0,303" | "0,284" | "0,283" | "0,494" | "0,038" | "0,028" | "0,036" | "0,032" | 19 | Military propaganda | 115 | 160 | 83,2 | 88,2 | Peaceful propaganda | 41,6 | 36 | 19,1 | 16,1 | "0,122" | "0,113" | "0,109" | "0,114" | "0,008" | "0,008" | "0,009" | "0,007" | 20 | War media | 2720 | 2680 | 1070 | 1010 | Peaceful media | 138 | 156 | 63,9 | 67,1 | "0,148" | "0,391" | "0,326" | "0,239" | "0,005" | "0,005" | "0,006" | "0,006" | | TOTAL for Sphere-2 | 6827,15 | 6888,6 | 2154,35 | 1481,643 | | 2946,53 | 2460,73 | 1573,37 | 1542,41 | "6,109" | "5,625" | "5,574" | "5,892" | "1,268" | "1,293" | "1,242" | "1,199" | World ORGSPHERE (Sphere-3) | 21 | Military organization | 449 | 480 | 407 | 332 | Peace organization | 395 | 362 | 251 | 192 | "0,459" | "1,49" | "1,09" | "1,26" | "0,171" | "0,162" | "0,139" | "0,15" | 22 | Military policy | 1410 | 1920 | 735 | 553 | Peace policy | 967 | 873 | 524 | 361 | "1,6" | "1,51" | "1,14" | "1,17" | "0,165" | "0,152" | "0,138" | "0,168" | 23 | Military budget | 256 | 236 | 36,5 | 7,87 | Peaceful budget | 47,1 | 47,9 | 35,3 | 36,2 | "0,306" | "1,81" | "1,27" | "1,32" | "0,024" | "0,016" | "0,016" | "0,012" | 24 | War law | 1430 | 1350 | 569 | 346 | Peace law | 650 | 543 | 475 | 424 | "0,102" | "0,131" | "0,109" | "0,119" | "0,083" | "0,117" | "0,107" | "0,098" | 25 | NATO about war | 207 | 237 | 134 | 98,9 | NATO about peace | 121 | 127 | 59,2 | 42,6 | "0+" | "0+" | "0+" | "0+" | "0+" | "0+" | "0+" | "0+" | 26 | G8 about war | 15,9 | 21,4 | 13 | 9,3 | G8 about peace | 7,45 | 6,95 | 5,56 | 4,69 | "0" | "0*" | "0*" | "0*" | "0" | "0*" | "0*" | "0*" | 27 | U.S. government about war | 1320 | 1180 | 418 | 28 | U.S. government about peace | 361 | 425 | 279 | 40,5 | "0+" | "0+" | "0+" | "0+" | "0,001" | "0+" | "0+" | "0+" | 28 | Russian government about war | 392 | 573 | 283 | 305 | Russian government about peace | 186 | 177 | 96,2 | 80,8 | "0" | "0+" | "0+" | "0+" | "0+" | "0+" | "0+" | "0+" | 29 | Putin about war | 306 | 553 | 114 | 108 | Putin about peace | 124 | 151 | 35,2 | 23,5 | "0,004" | "0,002" | "0,007" | "0,005" | "0+" | "0+" | "0+" | "0+" | 30 | Obama about war | 1410 | 1470 | 362 | 391 | Obama about peace | 510 | 492 | 142 | 151 | "0,044" | "0,025" | "0,018" | "0,011" | "0,005" | "0,004" | "0,004" | "0,004" | | TOTAL for Sphere-3 | 7195,9 | 8020,4 | 3071,5 | 2179,07 | | 3368,55 | 3204,85 | 1902,46 | 1356,29 | "2,515" | "4,968" | "3,634" | "3,885" | "0,449" | "0,451" | "0,404" | "0,433" | World TECHNO(ECO)SPHERE (Sphere-4) | 31 | Military arsenal | 54,7 | 93,1 | 39,2 | 32,8 | Peaceful arsenal | 4,75 | 52,9 | 2,36 | 2,61 | "0,134" | "0,131" | "0,143" | "0,143" | "0,001" | "0+" | "0+" | "0+" | 32 | Military weapons | 323 | 327 | 132 | 169 | Peaceful weapons | 34,5 | 32,4 | 13,6 | 12,7 | "0,515" | "0,558" | "0,536" | "0,283" | "0,011" | "0,003" | "0,012" | "0,014" | 33 | War technics | 14,8 | 12,7 | 5,29 | 5,16 | Peace technics | 1,61 | 78,4 | 98 | 84,8 | "0,003" | "0,004" | "0,004" | "0,004" | "0,001" | "0+" | "0+" | "0+" | 34 | Military tests | 432 | 709 | 198 | 49,4 | Peaceful tests | 58,7 | 41,5 | 6,49 | 6,03 | "0,08" | "0,085" | "0,065" | "0,064" | "0,001" | "0,001" | "0,001" | "0,001" | 35 | Military nuclear energetics | 54,6 | 46,5 | 62,5 | 67,8 | Peaceful nuclear energetics | 0,249 | 0,211 | 0,222 | 0,208 | "0" | "0*" | "0*" | "0*" | "0+" | "0+" | "0+" | "0+" | 36 | Network war | 1370 | 1190 | 633 | 355 | Network peace | 548 | 404 | 290 | 250 | "0,192" | "0,33" | "0,204" | "0,187" | "0,027" | "0,027" | "0,033" | "0,029" | 37 | War-industrial complex | 117 | 79,3 | 47,4 | 28,7 | Peace complex | 204 | 163 | 66,7 | 55,1 | "0,267" | "0,247" | "0,271" | "0,08" | "0,016" | "0,015" | "0,017" | "0,003" | 38 | Competitive war | 178 | 140 | 111 | 114 | Peaceful competition | 26,1 | 25 | 11,1 | 32,5 | "0,062" | "0,013" | "0,015" | "0,017" | "0,036" | "0,04" | "0,04" | "0,04" | 39 | Economic war | 617 | 569 | 117 | 8,33 | Peaceful economy | 46,5 | 43 | 20,4 | 15,2 | "0,514" | "0,668" | "0,481" | "0,579" | "0,011" | "0,01" | "0,012" | "0,01" | 40 | Ecological war | 20,4 | 13,4 | 14,1 | 14 | Peaceful ecology | 3,96 | 4,15 | 2,61 | 2,78 | "0,026" | "0,021" | "0,031" | "0,006" | "0,004" | "0,005" | "0,005" | "0,004" | | TOTAL for Sphere-4 | 3181,5 | 3180 | 1359,49 | 844,19 | | 928,369 | 844,561 | 511,482 | 461,928 | "1,793" | "2,057" | "1,75" | "1,363" | "0,108" | "0,102" | "0,121" | "0,102" | TOTAL for the Four Spheres of World Society | | TOTAL for WAR | 20734,1 | 22397,08 | 8020,27 | 5107,933 | TOTAL for PEACE | 8283,489 | 7515,471 | 4583,622 | 4245,768 | "514,121" | "562,033" | "516,657" | "325,562" | "191,01" | "188,273" | "187,392" | "153,519" | | TOTAL for WAR in % | ~71 % | ~75 % | ~64 % | ~55 % | TOTAL for PEACE in % | ~29 % | ~25 % | ~36 % | ~45 % | First Priority | "~73 %" | "~75 %" | "~73 %" | "~68 %" | Second Priority | "~27 %" | "~25 %" | "~27 %" | "~32 %" |
Conclusion: Monitoring peace and war priorities in the world public consciousness in GPS SOCIONOME Paradigm in English Language through GOOGLE registered:THE PRIORITY BELONGS TO WAR EXCEEDING PEACE PRIORITY ABOUT 3 TIMES. IN THE RUSSIAN LANGUAGE IT IS ABOUT 3-9 TIMES. The first quarterly monitoring on January 1, 2014 showed that, in public consciousness, the priority of war EXCEED peace priority, at least 3-9 times, and actually still is many times greater in view of the vast array of secret military information of numerous military ministries and departments BEYOND Internet and public consciousness as shown by Snowden and Wikileaks revelations. Military information is like an iceberg, the available part of which in the Internet is only the smallest part. This fact can be interpreted in only one way: it means that humanity today feasts, especially on unlimited consumption of the rich countries and on the arms race, in time the plague (rule) of military consciousness may dominate everything. There are no other evaluations. We think that public consciousness can be treated and released from militaristic plague with help of GPS, the transformative work of peace-makers around the world, and acceptance of the Constitution for the Federation of Earth (www.wcpa.biz/english/constitution/about_earth_constitution.htm). In such dominance of military consciousness, what is surprising is not this fact but why humanity does not start out with a total war of all against all? The answer to this question and its explanation gives the GPS first chapter: total war of all against all is excluded by harmonious spheral classes – SPHERONS, which define the insurmountable social, political, economic and spiritual potential of global peace that is revealed in GPS. Our monitoring is intended to show the trend of the military plague of consciousness, asking: does it grow and foretell war’s expansion for the people of Earth and acceleration of the arms race or does humanity suppress it spontaneously with cures from this militaristic pathology, even in small steps? This trend today is unknown to anyone, any nation, institution or government, even the UN and UNESCO. only similar monitoring organized by any government, institution and international organization is able to show what is happening with the military offshoots in world consciousness: do they grow and do we find ourselves deeper in their pathology or are these declining and humanity is released from them gradually? The scientific answer to this question, at least approximately, in such monitoring is essential for global peace, for human survival, including everyone on the planet. This is because the prevalence and growth of the military mind as the beginning of all wars calls into question the most valuable for everyone - life and the most important human right - the right to life. Moreover, the weapons as the main war tool, have created a military intelligence, ruining the economy not only during the fighting but also during its peace production undermining the economy from within and transforming a whopping set of useful resources in useless and harmful. The weapons production devours GDP growth, the economy drowns in endless economic and financial crises that we see now. The official (understated) 2% of GDP for military spending threatens to engulf the other 98%. Therefore, our monitoring is a barometer not only of peace and war but also the economic health of humanity. Comments and short explanation of the Tables Definitions of peace and war in Wikipedia are: Peace is an occurrence of harmony characterized by the lack of violence, conflict behaviors and the freedom from fear of violence. Commonly understood as the absence of hostility and retribution, peace also suggests sincere attempts at reconciliation, the existence of healthy or newly healed interpersonal or international relationships, prosperity in matters of social or economic welfare, the establishment of equality, and a working political order that serves the true interests of all: http://en.wikipedia.org/wiki/Peace War is an organized and often prolonged conflict that is carried out by states or non-state actors. It is generally characterised by extreme violence, social disruption, and economic destruction. War should be understood as an actual, intentional and widespread armed conflict between political communities, and therefore is defined as a form of political violence or intervention. The set of techniques used by a group to carry out war is known as warfare. An absence of war is usually called peace: http://en.wikipedia.org/wiki/War Glen Martin’s extended editing these definitions is given in italics: Peace is an occurrence of harmony characterized by the lack of violence, conflict behaviors and the freedom from fear of violence, within institutions that are democratic, pluralistic, and founded on the common good of all. Commonly understood as not only as the absence of hostility and retribution, peace also suggests sincere attempts at reconciliation, the existence of healthy or newly healed interpersonal or international relationships, prosperity in matters of social or economic welfare, the establishment of equality, and a working political order that serves the true interests of all. War is an organized and often prolonged conflict that is carried out by states or non-state actors. It is generally characterised by extreme violence, social disruption, and economic destruction. War should be understood as an actual, intentional and widespread armed conflict between political communities or other organized groups, and therefore is defined as a form of political violence or intervention. It includes human relationships predicated on domination, or victory, over a perceived enemy, and hence, as such, precludes reconciliation, dialogue directed toward mutual understanding, or other forms of democratic, nonviolent interpersonal or international relationships. An absence of war is usually called peace. However, peace, as noted above, moves far beyond the absence of war to a positive condition of interpersonal and institutional harmony.
Comments to the Tables 1. The Monitoring Tables in Russian (RU) and English (EN) languages are a sociological observation of a quality of uses in the Internet presented in the tables terms "peace" and "war" in the numerous variants/positions through GOOGLE search engine to rate, control and forecast their. Of the many Internet search engines, GOOGLE is selected as the most powerful and universal. Our Monitoring is a constant barometer of state of world public consciousness/opinion on such important attributes and dimensions of global society as peace and war in two of the plurality of linguistic areas of the Internet – RU and EN. 4. The tables’ key terms and concepts are "peace" and "war" with their adjectives: "peaceful" and "military." 5. In Russian, the word "peace" has two very different meanings: (a) the world as a universe and (a) peace as a state of society in the absence of war. In English, they are expressed in different terms: "world" and "peace", which is clearer than in RU. The problem of specification for term "peace" in Russian language is solved by the inclusion of the following clarification : "peace (war absence)" as it is used in Wikipedia RU. 6. Of the colossal polysemantic and multidimensional space of meanings "peace" and "war", we selected 40 concepts in one of the lexical expressions to form in tables the numbered horizontal position identical for columns "peace" and "war". These 40 concepts include 10 concepts corresponding to the four world spheres of global society and to the analogous spheral classes of the population [1, 34-36], employed in them. (Spheral classes are unfolded in the special chapter in the GHA’s new book.) This ensures a uniform and balanced representation of these spheres and their classes in the tables. 7. These spheres in a single coherent and holistic system of global society are presented in SOCIONOME - social genome of global harmony/peace [1, 40-41]. SOCIONOME is a basic theoretical sociological paradigm for the tables and for global peace science as a whole, the instrumental part of which they are. SOCIONOME provides tables by the main - stable global social structure of positions on four fundamental spheres of the world society as a whole, which are areas of global harmony and world peace simultaneously. The greater precision of tables requires in the 2-5 times more positions to reduce the level of their errors, but because of the enormous complexity of their analysis and calculation it is not possible on the GHA’s voluntary basis. This is a task for their future development in the institutional framework. 8. Considering the relativityof GOOGLE data, they are intended not for absolute quantification of different semantic features of "peace" and " war " but only to compare them both vertically (columns) and horizontally (on positions) as well as between spheres that will allow to determine the appropriate quantitative proportions and priorities. This is the main purpose of tables, which provide monitoring priorities of war and peace in the world public consciousness/opinions in its dynamics by quarters of each year, starting since 2014. It begins with global peace science (GPS). 9. Of course, these tables have many limitations caused by many different reasons, but over time they, like any scientific tool, will be improved. Despite their limitations, the list of which we summarize at the end of 2014, these tables allow us for the first time to monitor dynamics of priorities of war and peace in world public opinion that is not done by anyone else. Therefore, scientific and practical value of these tables is difficult to overestimate. They are important for scientific research and for various international peacekeeping and political organizations, including the UN and UNESCO, concerned with the state of global peace and the dynamics of its secondary priority compared with the primary priority of the war, which is found in almost every cell of the tables. 10. on the toughest request: "Global/world peace science=book/article" GOOGLE says: "no results." This means that in the global search engine is no information about any book or article of the same title that confirms full absence of this science. 11. The monitoring tables can exist in a variety of options, among of which our version is only one of many. We enumerate their other options: (1). Not in two languages (RU and EN) but in six, at least, the UN official languages, (2). Not in the quarterly but in monthly and others time formats, (3). Not for 40 but for 80, 120, 160 or 200 content items, (4). Not only for the world as a whole but also for the continents, regions, countries and other major spatial formats, (5). on separate habitats of world religions and so on. The formation of similar tables and their monitoring – is a colossal and constant job requiring special scientific international Institute in the UN or UNESCO. For this work the forces and opportunities of the GHA volunteers are clearly insufficient. 12. The GHA is currently considering the establishment of a network of similar monitoring centers in India, Africa, Europe, Russia, Kazakhstan and other countries and continents. on the basis of this project, the TV program "War and Peace" has also been established to discuss the dynamics of the priorities of peace and war in public consciousness, which is the first source of any war and any aspirations to peace as recorded in UN and UNESCO documents. It will be a strong barrier to new wars. Brief explanation of the meaning, purpose and importance of monitoring (Its detailed explanation is GPS in a whole) As is well known, war and peace begin with the consciousness that is written in the UN Charter [2] and UNESCO Constitution [3]. Therefore, the meaning of proposed monitoring is to constantly observe the dynamics of war and peace priorities in the public consciousness within various parameters/positions in four world spheres, presented in SOCIONOME as the quintessence of global peace science produced in the GHA. In this monitoring the paramount importance has no figures as quantitative values of different positions but the proportions or reciprocal relationship between them as on the table columns and horizontally between positions and also among the spheres, consequently, between the spheral classes, active in these spheres. As our tables demonstrate in RU and EN, modern people, including scientists and governments, prefer to talk and think more about war than about peace approximately 3-9 times more. The scientists prefer many times more to explore war than peace. The "military growth" concerns humanity almost in 6 (RU) and 60 (EN) times more than the "peacemaking growth," as shown in a comparison of relevant data of GOOGLE. The Internet is filled with themes of the inevitability of a third world war, a war with the Muslim world, Iran, North Korea, China, Russia, the U.S., NATO and so on, with almost every country. Therefore, the public consciousness of modernity has a pronounced military priority – this is militarist consciousness and thinking of dying modern industrial civilization. In modern public consciousness, about one-quarter is peaceful and three quarters - is military and militaristic, as shown by this study. With all its limitations and possible deficiencies, it is convincing empirical evidence of the war priority and not peace in modern public consciousness. Sadly, war is considered at least three times more important and valuable and urgent than peace. The data for some items are staggering in comparison with the monstrous, in thousand times or more, prevalence of military priorities. According to scientists-historians, in the history of mankind there have been over 15,000 wars, in which up to 3.5 billion people were killed. Therefore, human history is recognized as "the history of self-destruction". We could say that humanity has always fought in history. Historians estimate that for the past 5500 years, people have been able to live in peace for only a paltry 300 years, which means that civilization lived in peace in every century for only a week"[4]. As seen from the monitoring, humanity does not intend to depart from this suicidal tradition, continuing to give priority to war instead of peace and keeping its lack of peace consciousness. At humanity, as monitored, there is no science of the global peace, capable of consolidating its peaceful mind and giving it precedence over military consciousness and military practice. Of course, the public consciousness, as shown by its "peace/war" monitoring, is full with contradictions and paradoxes. If one speaks about self-destruction of mankind in these wars, then others, such as Steven Pinker, claim that "we are living in the most peaceful era in human history" after WWII [5]. Pinker ignores the arms race and perpetual increase of military spending. At the same time, according to R. Jackson [6], since 1945 the planet has experienced just 26 days of peace. In the Global Peace Index, it claims that the United States constantly raises the level of peace and that Russia lowers it continually [7]. However, according to the independent information center “Common Dreams”, the opposite is true: The U.S. is the "Biggest Threat to World Peace", is measured at 24%, and the threat of Russia is measured at 2%, which is 12 times less than the threat of America [8]. Other fact says: "The Federation of American Scientists has cataloged nearly 200 military incursions since 1945 in which the United States has been the aggressor"[9]. Such facts of monitoring, which we use throughout this book, attest the great uncertainty of public peace consciousness. It remains devoid of the common objective, i.e. scientific foundations and landmarks for understanding and evaluation of global peace. The peaceful mind has lagged behind the military mind, judging by the development of appropriate science, by more than 200 years. Military science began since 1799 [10] and global peace science (GPS) began only in 2012 with the ABC of Harmony for World Peace… [1], which finds its development in a special expression of the scientific theory of global peace in the GHA corresponding book only in 2014. Monitoring the dynamics of peace and war priorities in the world public opinion has no less global importance and no more deficiencies than other peacekeeping tools of similar nature such as the Global Peace Index [7], the Happy Planet Index (aspiring to reflect the real welfare of the nations [11]) and the like. Monitoring social consciousness within the dynamics of its priorities of war and peace - this is one of the essential and high-tech innovative tools of global peace science. The final generalizing model of Tetranet thinking* for our monitoring builds on the following chain of key concepts, expressing its harmonious whole from start to finish: 1. Socionome of global peace - 2. Internet + Google - 3. Data of war and peace - 4. Monitoring of these priorities. Model-4. Epistemology of monitoring in global peace science
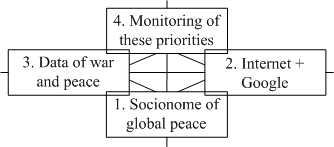
*Philosophy and methodology of the four-dimensional harmonious holistic and network thinking, abbreviated - Tetranet thinking found a detailed study, expression and application in the ABC of Harmony [1, 68-79, etc.] and its previous works, summarized in it. Bibliography 1. Semashko, Leo and GHA 75 coauthors (2012). The ABC of Harmony for World Peace, Harmonious Civilization and Tetranet Thinking.New Delhi, Doosra Mat Prakashan. http://peacefromharmony.org/?cat=en_c&key=478 2. Charter of the United Nations. www.un.org/en/documents/charter/index.shtml 3. Constitution of the UNESCO: http://unesdoc.unesco.org/images/0021/002161/216192e.pdf#page=7 4.http://oko-planet.su/history/historynew/202828-istoriya-chelovechestva-kak-istoriya-samounichtozheniya-35-mlrd-chelovek-pogiblo-v-voynah.html 5. Pinker, Steven (2011). The Better Angels of Our Nature: Why Violence Has Declined. Viking, http://ge.tt/1gnq3JX/v/7 6. Jackson, Robert J. (1997) NATO AND PEACEKEEPING. Visiting Fellow Centre for International Studies and Clare Hall, University of Cambridge. Final Report for NATO Fellowship. http://www.nato.int/acad/fellow/95-97/jackson.pdf 7. http://en.wikipedia.org/wiki/Global_Peace_Index 8. http://www.commondreams.org/headline/2013/12/31-6 9. http://www.goodreads.com/book/show/8717.Perpetual_War_for_Perpetual_Peace 10. Bülow, Adam. D. H. von. Geist des Neueren Kriegssystems (Spirit of Modern Military Systems) http://reader.digitale-sammlungen.de/resolve/display/bsb10784466.html 11. http://en.wikipedia.org/wiki/Happy_Planet_Index 2.8. Program of Statistical Study of SPHERONSof Educational Institutions The Sociological Statistical Study (SSS) of Dynamics of Global Social Structure (Four Spheral Classes of the Population - SPHERONS) at Level of Base Educational Institutions (BEI) - School, College and University is only a little part of the GHA fundamental study: "Dynamics of the Global Social Structure of Spheral Classes: Example of India, USA, Russia and Kazakhstan since 1950 by Decades" (below), which is the empirical basis for GPS: www.peacefromharmony.org/?cat=en_c&key=579. A similar elementary research can be carried out in any organization and not just in the BEI. 1. SSS Purpose The SSS purpose is in statistical expression of the dynamics of global social structure as dynamics of spheral classes at the BEI level: separate schools, colleges and universities of the world since 2000. For simplicity of SSS, we assume it only for four time points: 2000, 2005, 2010 and 2013, which are enough to scientifically determine the underlying trend in the dynamics of spheral classes in BEI. The elementary researches within SSS will be a part of the Global Peace Science empirical base of and will be published in its book along with fundamental research at the countries level: USA, Russia, India, etc. 2. SSS Hypothesis The SSS hypothesis is the assumption about existence of universal spheral classes, expressing global social structure on all social levels starting from family and theand most simple, vivid and accessible to direct observation of schools, colleges and universities and the possibility of statistical representation of these classes in the spheral aggregated indices. The proof of this hypothesis is the scientific meaning for SSS determining its colossal scientific significance as a revolutionary scientific discovery of spheral harmonious classes, which are not yet known for social science. Therefore, the study of these classes still nowhere and never carried out in the world, them still nobody tried to count with the sole exception in the book - Tetrasociology: Responses to Challenges (2002: www.peacefromharmony.org/?cat=en_c&key=145). Anyone, who will hold the similar elementary SSS, available every literate person, will be involved in this landmark scientific breakthrough in human history and will be able to understand it deeply. 3. SSS Task The SSS task is to prove the existence of spheral classes expressing global social structure and the possibility of their statistical representation in spheral aggregated indices at the simplest level of BEI. 4. Statistics of Spheral Classes, SPHERONS at a BEI Level Statistics of spheral classes is a fundamentally new scientific technology and instrument of Tetrasociology. The spheral classes have different content in different branches and often have disparate statistical expression in different countries and at different periods of the same country. Therefore, traditional statistics are insufficient and unsatisfactory for quantitative expression of the spheral classes’ dynamics in different countries. Traditional statistics is not suitable to count them, as well as to quantify the global social structure but it is a necessary information base to form spheral aggregates. New, spheral statistics of the aggregated spheral indices was created together with discovery of spheral classes, which are built (aggregated) from traditional statistical indices. The theory of spheral statistics has been unfolded in several books but most of all in the already mentioned Tetrasociology in the section "Discovery of sociological statistics" (p. 48-51) and in the ABC of Harmony in section "Statistics of Harmony Elements" (p. 51-54). We will not repeat here this theory but only briefly express its features necessary for our SSS. 1. Spheral Statistics is built on alphanumeric indices of the PIOT resources, called by the spheral indices, of which constitute the necessary row of matrix 4 x 4 to a power of "n", where "n" is a line of natural numbers. 2. For SSS concerning only one resource - People employed in BEI, it is enough to have spheral indices only of this class, which is presented in the following them line: P = P1 + P2 + P3 + P4, Where P – quantity/number of people of studied object: in our SSS it is any BEI, P1 - socioclass employed in the sociosphere: for any BEI it is the teachers and students; P2 - infoclass employed in the infosphere: for any BEI it is the librarians and the like; P3 - orgclass employed in the orgsphere: for any BEI it is the managers of all levels; P4 - technoclass employed in the techno(eco)sphere: for any BEI it is the technical staff. 3. Indices P, P1, P2, P3, P4 have a single standard unit of measurement in thousands of people or just people. 4. An index of P1 (socioclass) for any BEI is the sum of two parts: the number of status employed (teachers, working in any BEI) and occupied by educations - students. Then P1 = P1w +P1s and P = P1 (P1w + P1s) + P2 + P3 + P4. 5. The number of any BEI in any given year is the sum of its four spheral classes: P = P1 (P1w +P1s) + P2 + P3 + P4. This is a fundamental law of the spheral classes at all levels from family, BEI, city, country up to the world as a whole. The preparation of these indicators for any BEI in the indicated periods (2000, 2005, 2010 and 2013) is the desired end result of SSS. The indices of number of population, people and all of their social groups are key for scientific knowledge of society and for calculation of other social indices. The spheral classes are objective alternative to Marx’s antagonistic economic classes and all other private groups that constitute the source of all social violence, injustice and war in any society. 5. Table of Indices for Spheral Classes of any BEI The table below for indices of the BEI spheral classes is a methodical algorithm for their formation in SSS. It is an algorithm of aggregating (summing) the traditional statistical indices in the spheral indices. The branches’ titles in the table are borrowed from the State Statistics of Russia. In other countries, they may be different. The report on each BEI in any country is exhaust by Table-1. SSS of the BEI: Title of School, College or University, City/Town, Country, the year from which the BEI started to work. Author: Name, position, address, E-mail and phone Table. Dynamics of SPHERONS in this BEI in thousands of people or in persons since 2000 to 2013 Spheral indices | The employed | 2000 | 2005 | 2010 | 2013 | P | All People in a BEI: P =P1 +P2 +P3 +P4 | | | | | P1 | Socioclass, P1 = P1w + P1s | | | | | P1w | P1w = sum of the employed in branches of sociosphere: | | | | | | Education – Teachers number | | | | | | Health – Medical Staff number | | | | | P1s | P1s = Students number | | | | | P2 | Infoclass = sum of the employed in branches of infosphere: | | | | | | Librarians number | | | | | | Bookkeeping number | | | | | | Other information service number | | | | | P3 | Orgclass = sum of the employed in branches of orgsphere: | | | | | | Management staff of BEI at all levels | | | | | | Lawyers | | | | | | Security | | | | | P4 | Technoclass = Technical staff number: supply manager, electrician, mechanic, cleaning ladies, more | | | | |
Date: March__, 2014 The Table-1 includes in the total 15 indices, for four years – 60 statistical data. The SSS task of any BEI for each country is the same. only the identity of statistics provides their full-scale internal comparability within them and across countries and regions. The SSS report for each educational institution in each country is limited by four years: 2000, 2005, 2010 and 2013, and is expressed as a single complex of 7 spheral indices and 10 branch indices, from which the spheral indices are made. The spheral indicators P1s and P4 are identical to the branch indices. The report is limited by this Table that makes it available to any teacher. The SSS report fulfillment is very simple, in three steps and does not require much time: maximum of 2 - 8 hours, depending from the availability of the necessary statistical information. Step 1. The researcher in this SSS prints on the home computer printer the Table -1 on one page. Step 2. In the BEI archives or in its Bookkeeping department the researcher records the statistical data of 10 branch indices to Table-1 for 4 years: 2000, 2005, 2010 and 2013. Step 3. The researcher summarizes these data and receives the remaining 5 indices in Table 1. The filled Table -1 is stored in a separate electronic document, which is sent by e-mail attachment to the Editor in Chief of the GPS book: Dr. Leo Semashko: leo.semashko@gmail.com 2.9. Dynamics of SPHERONS in India, Russia, USA and Kazakhstan for 1950-2010 by Decades Program of Comparative Sociological Statistical Study (CSSS) Updated and abridged edition of the CSSS Program 2013 Full CSSS Program 2013 is published here: www.peacefromharmony.org/?cat=en_c&key=579 Authors: Dr. Leo Semashko, Project Initiator and Manager, Editor in Chief and 18 GHA coauthors: Glen Martin, Charles Mercieca, Bruce Cook, Harry Gensler, Laj Utreja, Maitreyee Roy, Surendra Pathak, Subhash Sharma, Subhash Chandra, Bishnu Pathak, Uraz Baimuratov, Raissa Kaziyeva, Ayo Ayoola-Amale, Heli Habyarimana, María Cristina Azcona, Celia Altschuler, Ammar Banni, From 10 countries: Algeria, Argentina, Ghana, India, Kazakhstan, Nepal, Puerto Rico, Russia, Rwanda, USA Contents I. Research 1. Introduction. Global Social Structure of SPHERONS: Globalization of Sociology, Statistics and Social Science in Whole 2. CSSS Scientific Problem and its Restrictions on Countries and Period 3. Object and Subject of CSSS 4. Theoretical Substantiation of Spheral Classes of Population as Global Social Structure 5. CSSS Purpose 6. CSSS Hypothesis 7. CSSS Task I.I. Statistics 8. Statistics of Spheral Classes and their Spheral Indices in CSSS 9. Table of Spheral Indices for Spheral Classes and Methods of their Formation in CSSS 10. Tables of Spheral Indices for Certain Qualities of Spheral Classes in CSSS 11. A Single Research Complex of Statistical Indices for Each Country and Common Content of Report on them 12. CSSS General List of 27 Spheral Indices with Decoding of their Acronyms 13. Sample of Statistical Data for Spheral Classes and their Qualities I.II. Analysis 14. Analysis: Comparison and Conceptual Interpretations. 15. CSSS Conclusion 16. Presentation of CSSS Results: Reports, Graphics, Requirements to the Texts, and etc. 17. Publication of CSSS Results in Book 18. CSSS List of Literature
I. Research 1. Introduction. Global Social Structure of SPHERONS: Globalization of Sociology, Statistics and Social Science in Whole We, sociologists, need statistical data no less than theory if that theory is to become useful in solving problems. Bernard Phillips, sociologist, USA, 2003. The theme of the proposed sociological study (CSSS) fits well into the context of the problems of modern world sociology, statistics and social science as a whole. But it is necessary to understand and express as motivation of this CSSS and its world signification. World sociology has long been studying the processes of globalization that mark, in its definition, a special era - the Age of Globalization - in recent history. This era has put social science (sociology, statistics, demography, economics, history, political, law, cultural, psychological, and similar sciences) in the face of a global cognitive challenge – the study of a single global reality. This is an unprecedented challenge which social science has not been able to face in the past. World sociology’s first response to this challenge has emerged in the new self-determination of sociology as a "global" sociology. Its most detailed analysis is presented by Professor of Sociology Michael Burawoy, President of the International Sociological Association (ISA). Michael Burawoy, in his 2010 report "Facing the Challenges of Global Sociology", analyzed the current state of global sociology. He has kindly agreed to have this report published on the GHA website: www.peacefromharmony.org/?cat=en_c&key=435. He estimates global sociology as "the most ambitious project" for himself and for ISA, which "requires the development of alternative theoretical framework and research." Our CSSS fits this requirement. Michael Burawoy proposed: "My program would be to erect a global sociology on three legs, three Ms – Media, Membership, and Message." A more advanced version of global sociology requires the fourth, fundamental leg - global social structure with global statistics expressing it. This structure defines this statistics but its knowledge is impossible without quantitative expression. Therefore, global sociology and global statistics are inseparable on the basis of a single global social structure. This CSSS has been the first scientific empirical research to address this problem. Global social structure will help scholars to understand global sociology and global statistics, moving from a geographic level to an essential social level. This will constitute a qualitatively new, global, social science, with qualitatively new reality of global social structure in two inseparable aspects - sociological and statistical. Such a structure would be the fourth most fundamental dimension of global sociology and would also the deepest challenge for it and social science as a whole. Therefore the empirical statistical study of this structure is crucial. One of the main missions of global sociology, in Burawoy’s opinion, is integration with other social sciences "through the building of constituencies, publics, outside the academy," and in this way to be "a bastion of defense not only against the ascendant privatization and commodification of knowledge, but, more broadly, against new forms of commodifying labor, money, and nature that are generating cumulative crises of the 21st century" and against "the twin forces of market and state threatening the autonomy and existence of universities world-wide." Global social structure provides integration of sociology and statistics and, through it, integration with other social sciences: demography, history, economics, political science, and others, perfectly illustrating this CSSS and expressed in the ABC of Harmony (see below). This approach can ensure globalization of the social sciences and the best performance of their global mission with building of its constituencies, publics (outside the academy), retaining its autonomy and the existence of universities world-wide. Therefore, the proposed CSSS is extremely important for the integration and synergy of social sciences in their globalization, which will strengthen their social mission in the 21st century of global humanity. CSSS is the first pilot sociological and statistical study of global social structure, and other social sciences will be unable to ignore it. Without this research it will be difficult to attain globalization, integration and synergy of Social Sciences in the 21st century. This is their need and natural course of development in the new age. From the point of view of Burawoy, a global sociology integrates and develops the four inseparable qualities: "I think of sociology as having four moments – public to be sure, but no less important professional, critical and policy. Each depends upon the others..." only in this way can global sociology "contest such centrifugal pressures, and, more generally, endeavor to bridge the many geopolitical divides and build a global community of sociologists...and in this way forge a more dynamic ISA…Sociology – the best sociology – matters, not just for us but for others too. The world needs sociology, a global sociology attentive to global issues." Global social structure has played a key role in overcoming the centrifugal fragmenting forces, uniting diverse geopolitical sections and building not only the global community of sociologists and a dynamic ISA, but also humanity as a whole. Global social structure, a single effort at all levels from global to local and personal, possesses different expressions in different social sciences, removing polarization of these levels and the fragmentation of their knowledge in each discipline. Global social structure has the same key meaning for globalization and the synergy of other social sciences in order to overcome their centrifugal forces and their exit to the level of providing a joint scientific solution for global problems of the 21st century. Any attempt to study global social structure will support those scientific organizations that seek to create a global social science, especially global sociology together with global statistics. CSSS is a synergistic attempt of their simultaneous construction in a united study. The CSSS subject - global social structure of spheral classes of the population - constitutes global sociology and global statistics as a new fundamental and inalienable social science. It has great potential to yield knowledge that will prove useful to all people, nations and governments of the world, allowing them to understand their deepest social cohesion and offering them a new sociological and statistical language for joint scientific achievement, overcoming the problems of incoherence, fragmentation, mutual enmity, alienation and misunderstanding. CSSS has great potential to provide a united global social knowledge of humanity not only for sociology and statistics, but also for all social sciences. But first of all – it places sociology and statistics in a symbiotic relationship. This is the most urgent task of our social cognition. This knowledge can lead to conscious decisions, based on comprehensive social scientific knowledge and therefore excluding any violence, in a welcome transition of humanity to a global harmonious civilization. 2. CSSS Scientific Problem and its Restrictions on Countries and Period
The CSSS Introduction, above, outlines a scientific problem that has arisen within global sociology, and more broadly - in the social sciences in the Age of Globalization. This scientific problem can be defined as: identification (selection), statistical expression and explanation of the global social structure of spheral classes of the population (SPHERONS) in their comparative dynamics. In this study, we compare four countries. Of course, ideally, the identification of this scientific problem should include all countries of the world, but this is possible only in a future phase of the study, and will involve resources many times greater than what is available today. This initial four-country stage helps to determine the CSSS pilot character, and stands as the first systematic attempt of empirical study for this scientific problem. The selection of countries for this study was not random. Including India, USA, Russia and Kazakhstan, it covers a range from most numerous (India - 1.2 billion) to the less populated (Kazakhstan - 17 million), from developed countries (the U.S.) to those developing at different levels, providing a wide range of external manifestations. Similarly, the sample of study period in these countries: 1950 - 2010 years (60 years) is not accidental also, as it covers a period of relatively balanced development after the Second World War. This is the longest period in modern history that is available to compare the dynamics of global social structure in relatively stable status, being approximately the same for all countries in the world environment. Recommendation to statisticians: All indices calculate for each country within the same geographical boundaries of one year, the best in the last accounting year. By 2010, figures for other years should be corrected according to changes in the geographical boundaries of country in previous years. All of the statistical studies of countries should begin to reverse the historical count, beginning since 2010, to modify national statistics for the past years to the geographical boundaries of 2010. The division of study period by decades and identification for the national development of seven time points: 1950, 1960, 1970, 1980, 1990, 2000 and 2010 is identified by the pilot nature of this study and the need to compare the dynamics of global spheral classes among these countries in the first, most general and large-scale approximation. For the beginning, this scale is small enough to avoid complicating the study. In the future, nothing prevents studying in closer approximation, for example, five years, two years, or yearly. This opens up almost unlimited prospects for the study of dynamics of global social structure in each country in any period, at endless comparative complexes, for different scientific and practical purposes. 3. Object and Subject of CSSS The object of CSSS is the population of four countries. Population is an objective reality of any social structures and groups of people, including universal / permanent global social structure and its social actors in the face of spheral classes / groups. It is universal, but the latent structure and its universal and latent social actors (classes / groups) remain unknown to science. The subject of CSSS is four spheral classes of the population of selected countries (India, USA, Russia and Kazakhstan) in the period 1950-2010, together with dynamics of social, spiritual, political and economic harmony and justice between these classes. Spheral classes or SPHERONS are a special theoretical division of the population of any country on the universal basis of its employment in the four main spheres of social production. Spheral classes cover the entire population, without exception, as each person at all times of their life from birth to death being busy (employed, occupied), anyway, in the spheres of production, that remain unknown to the relevant scientific knowledge. For detailed explanation of the spheral classes on the basis of their employment, see below in the appropriate sources. 4. Theoretical Substantiation of Spheral Classes of Population as Global Social Structure This section focuses on the key theoretical clarification and interpretation of CSSS basic concepts and preliminary system analysis. The central concept of study is "spheral classes of the population," or shorter "spheral classes." Through them "global social structure" is determined in this CSSS. The concept of "spheral classes" was first used by Leo Semashko in 1976 (www.peacefromharmony.org/?cat=ru_c&key=305) and since then its theoretical development has passed many stages, as reflected in the author’s 12 books (see below), not counting his numerous articles. This concept earned the author a title of “dissident” in sociology of the Soviet Union because it is contrary to the Marxist economic definition of classes. In fact, Marxist economic definitions are still presenting Russian sociology, preserving the Marxist tradition in its theoretical depth, seemingly ignorant of other thoughts on social structure and pressing against any non-Marxist its understanding (www.peacefromharmony.org/?cat=en_c&key=534). From multiple sources on spheral classes, perhaps the most reasonable and professional is Leo Semashko’s book: Tetrasociology: Responses to Challenges (2002), prepared and dedicated to the 15th ISA World Congress of Sociology in Brisbane, Australia, 2002 (www.peacefromharmony.org/docs/2-1_eng.pdf or: www.peacefromharmony.org/?cat=en_c&key=145),where it was presented at many sessions of the Congress. A detailed definition of these classes was first published in this book, in Russian and English, in the section "Discovery of sphere classes as actors of social harmony": "Spheral classes represent four natural big groups of people covering the entire population of the world…, which are differentiated to spheres of their main productive employment. Equal social necessity for their employment makes them fundamentally harmonious, cooperative, fraternal and eliminating antagonism. Spheral classes are equally necessary for society, sufficient together but they are unequal within and among themselves on stratification criteria."(p.70, with a little modern editing) Here, for the first time, the calculation of statistical indices of spheral classes for the population of Russia in 1991 and 1996 is given, as well as the definition of each of these classes. Four spheral classes that make up global social structure are: 1. Socioclass employed in sociosphere, 2. Infoclass employed in the infosphere, 3. Orgclass employed in orgsphere, 4. Technoclass employed in technosphere. The sole and a fundamental criterion for distinguishing these classes is employment in one of the four spheres of social production, uniting the relevant branches. This category is central in definition of global social structure for this study. Employment is a universal natural and living characteristic of humans from birth to death. Therefore, for this study, the terms "employment", "productive employment" and "living, natural employment" are synonymous. Employment of spheral classes in the spheres of production (societal spheres) is "spheral employment." Spheral employment consists of "branch employment" of people in one of the branches, which, in turn, consists of "individual employment", i.e. employment of individuals in this or that sphere. The human belongs to all sphere classes, as he/she is employed every day in all spheres, moving from one sphere of employment to employment in other spheres. Every day a person is employed in every sphere of at least a minimum time, and this creates a special challenge in his/her spheral identification. It can be determined only by one criterion - the criterion of "main employment" in one sphere. This employment is the individual’s longest on-time employment among all types of spheral employment and has a number of formal criteria: status, position, education, training, etc. Main employment is "status employment" or "working population." Non-working people (non-working population) – there are all non-working groups in sociosphere: preschool children, students, pensioners, disabled, jobless and so on. They are different from other groups (from working population) their own "self-production", which is the main employment of these groups. The non-working population is the largest part of socioclass, another part of which is the working population by status in sociosphere. Socioclass is sum of these two parts. At each stage of life a person have one main sphere in which he has been employed for the longest time. He/she belongs to this or that spheral class at each living stage by this criterion of main employment. Therefore, the sphere classes are "soft", with no harsh economic, legal and other formal boundaries, and therefore "invisible", natural and spontaneous, classes that are visible only for the scientific, theoretical vision. But that does not prevent them to be the universal, fundamental and eternal components of global social structure in all of human history, although they remain unexplored and spontaneous so far. At the same time, it makes them less accessible and therefore most difficult to understand. Therefore, they are still largely unknown and have not been investigated. CSSS is the first systematic attempt to study them and to overcome the epistemological obstacles on path of them knowledge. On the surface of these soft and invisible, but universal and natural spheral classes of the population, unbound by any formal criteria except the main employment, form the historically transient classes and social structures. These are limited by various private economic, legal, social, spiritual, and similar criteria. Every era and civilization creates on the natural foundation of spheral classes the specific (temporary) social-class structures: castes, slavery, estates, economic classes (Marx), strata, etc., which are constantly replacing each other in history. They create the disharmonies as the sources of wars. Status employment in the spheres is employment in one of the spheral branches. The Tables of branches of each sphere are presented in the book Tetrasociology; see section "Tables of societal spheres of society" (p. 59-69). These tables are especially important for the CSSS, as they reveal the logical mechanism of aggregation of branch statistical indices into spheral, consolidated indices (about the statistics see below). The societal spheres are the extremely broad forms of employment. These spheres, as well as components of their branches and companies/institutions, differ, in turn, in the very broad subjects and products, which make the four necessary and sufficient resources of each society: People, Information, Organization, Things (PIOT). They were first identified in Alvin Toffler’s book The Third Wave in 1980. These resources are a product and subject of the corresponding spheres of production: 1. Sociosphere, subject and product of which are People 2. Infosphere, subject and product of which is Information, 3. Orgsphere, subject and product of which are Organizations 4. Technosphere, subject and product of which are Things. The definition of these resources, their necessity and sufficiency, as well as fundamental category of "employment" for understanding of spheral classes - is revealed in this book, in the section "Constants of social space-time" (p. 39-46) as well as in the ABC of Harmony (2012, pp. 25 - 44: www.peacefromharmony.org/?cat=en_c&key=478).The mentioned four spheres of production were first identified, but in other terms, by Karl Marx in The German Ideology in 1845. One particular difficulty is the question of terminology. The CSSS will use the shortest terminology presented in the ABC of Harmony. We will not reproduce here the theoretical content of these books, as empirical research –it is not a theory, it is only based on the theory in order to prove or disprove its hypothesis. So, CSSS is limited by the following set of theoretical concepts that will be used in all its sections and at all stages: • Spheral classes or SPHERONS: Socioclass, Infoclass, Orgclass, Technoclass. • Family of employment concepts: (natural) spheral employment, individual employment, main employment, status employment (employed population) and the self-production (non-working population). • Spheres of social production (societal spheres): Sociosphere, Infosphere, Orgsphere, Techno(eco)sphere, where (eco) is indicator: “economy and ecology”. • The resources of society, which are the spheres’ subject and product: People, Information, Organization, Things (PIOT). The complete absence of even one of them makes the existence of society and humans impossible. The life of every person and any society is determined by these necessary and sufficient resources, which are produced constantly by spheral classes employed in the corresponding spheres of production. The listed 20 concepts are minimum necessary and sufficient for the empirical CSSS, constituting its conceptual framework and providing a preliminary system analysis of its object - the population of society. Derivative concepts are based on these. Of course, we must understand that the theory of spheral classes, like any scientific theory, is constantly being developed and improved, for it still has many unsolved problems. However, these do not interfere with the hypothesis and carrying out an appropriate empirical study. Absolute theoretical perfection does not exist, so we can not refuse empirical study just because we lack perfection. Empirical research will help to raise the theoretical perfection to a new, relative, level. 5. CSSS Purpose The CSSS purpose is in statistical expression of the dynamics of global social structure as dynamics of spheral classes in cases of India, USA, Russia and Kazakhstan since 1950 by decades, providing a theoretical generalization of this process and comparison of these processes in different countries and at different periods. 6. CSSS Hypothesis The CSSS hypothesis is the assumption about existence of universal spheral classes, SPHERONS, expressing global social structure, and the possibility of their statistical representation in aggregated spheral indices in four countries. The proof of this hypothesis is the scientific meaning and destination of CSSS. Basically, we are proving that these classes and structure exist and will withstand analysis. 7. CSSS Task The CSSS task is to prove the existence of spheral classes expressing global social structure and the possibility of their statistical representation in spheral aggregated indices in four countries. I.I. Statistics 8. Statistics of Spheral Classes and their Spheral Indices in CSSS Statistics of spheral classes is a fundamentally new scientific problem of instrumental nature in CSSS, as these classes were unknown to science and nobody has calculated them in the past. Spheral classes have different content in different branches, and often have disparate statistical expression in different countries and at different periods of the same country. Therefore, traditional statistics are insufficient and unsatisfactory for quantitative expression of the spheral classes’ dynamics in different countries. Traditional statistics is not suitable to count them, as well as to quantify the global social structure, but it is a necessary information base to form spheral aggregates. New, spheral statistics of the aggregated spheral indices was built together with discovery of spheral classes. The theory of spheral statistics has been published in several books (see below), but most of all in the already mentioned Tetrasociology in the section "Discovery of sociological statistics" (p. 48-51) and in the ABC of Harmony in section "Statistics of Harmony Elements" (p. 51-54). This theory is explained in summary form below: 1. Spheral Statistics is built on alphanumeric indices of PIOT resources, called the spheral indices, which constitute the necessary matrix 4 x 4 to a power of "n", where "n" isaline of natural numbers. 2. For CSSS concerning only one resource - People (the population), it is enough to have spheral indices only of this class, which is presented in the following them line: P = P1 + P2 + P3 + P4, Where P–quantity/number of population of the studied object (world, region, country, federal unit, city, municipality, enterprise) which, in CSSS, is the population of four countries, P1 - quantity of socioclass employed in production of P, i.e. employed in the sociosphere, P2 - quantity of infoclass employed in production of I, i.e. employed in the infosphere, P3 - quantity of orgclass employed in production of O, i.e. employed in the orgsphere, P4 -quantity of technoclass employed in production of T, i.e. employed in the techno(eco)sphere. (Technosphere is an economic and ecological sphere abbreviated expressed as techno(eco)sphere. The concepts ‘technosphere’ and ‘techno(eco)sphere’ are synonymous.) 3. Indices P, P1, P2, P3, P4 have a single standard unit of measurement in millions of people. 4. Indices P1 (socioclass), as defined above, is the sum of two parts: the number of status employed (working) in sociosphere and the employed of self-production (non-working population). Their indices are: P1 = P1w +P1s. Then, P = P1 (P1w + P1s) + P2 + P3 + P4. 5. The population of each country in any given year is the sum of its four spheral classes: P = P1 (P1w +P1s) + P2 + P3 + P4. This is the fundamental law of the spheral classes. The preparation of these indicators for the four countries in the indicated periods with some of their characteristics (below), as well as their comparison across countries and their interpretation in the various quality dimensions, is the desired end result of CSSS. 9. Table of Spheral Indices for Spheral Classes and Methods of their Formation in CSSS The table below - spheral indices for spheral classes - is a methodical algorithm for their formation in CSSS. It is an algorithm aggregating (summing) the traditional statistical indices in the spheral indices. The branches’ titles in the table are borrowed from the past State Statistics of Russia. (Variant of 2010 classification is presented above in the article of Olga Kashina and Leo Semashko for comparisons and additions). In other countries, they may be different. The report on each country must include the branches’ titles (classifications) taken in the state statistics of these countries on 2010. This creates some difficulties in identification of branches in each country. To overcome them is one of the tasks of statistical experts. Table 1. Quantity/number of spheral classes of the population (country*) in millions of people Spheral indices | Employed | 1950 | 1960 | 1970 | 1980 | 1990 | 2000 | 2010 | P | All Population: P = P1 + P2 + P3 + P4 | | | | | | | | P1 | Socioclass,P1 = P1w + P1s | | | | | | | | P1w | P1w = sum of employed in branches of sociosphere: | | | | | | | | | Education | | | | | | | | | Health | | | | | | | | | Physical Culture and Sport | | | | | | | | | Social security | | | | | | | | | Other (Emergency rescue workers, trade unions, churches, charities, etc.) | | | | | | | | P1s | P1s = sum of self-production employed (non-working population): | | | | | | | | | Preschoolers | | | | | | | | | Students (full-time) | | | | | | | | | Retirees | | | | | | | | | The Unemployed/unoccupied | | | | | | | | | Housewives | | | | | | | | | Other (list) | | | | | | | | P2 | Infoclass = sum of employed in branches of infosphere: | | | | | | | | | Science and scientific services | | | | | | | | | Art and Culture | | | | | | | | | Communication service | | | | | | | | | Other (list) | | | | | | | | P3 | Orgclass = sum of employed in branches of orgsphere: | | | | | | | | | Apparatus of government | | | | | | | | | Apparatus of private management | | | | | | | | | Finance, credit, insurance | | | | | | | | | Other (Defense, Ministry of Internal Affairs, State Security, Customs, etc.) | | | | | | | | P4 | Technoclass = sum of employed in branches of technosphere: | | | | | | | | | Industry | | | | | | | | | Agriculture and forestry | | | | | | | | | Construction | | | | | | | | | Transport | | | | | | | | | Trade and food services | | | | | | | | | Housing and communal services | | | | | | | | | Conservation of nature (ecology) | | | | | | | | | Other (list) | | | | | | | |
The total for Table-1 includes 34 indices. *Countries: India, USA, Russia and Kazakhstan. 10. Tables of Spheral Indices for Certain Qualities of Spheral Classes in CSSS Spheral classes have a wide variety of social qualities, each of which constitutes an appropriate direction/trends and indices for CSSS. These qualities are also different for social profiles of spheral classes. The first pilot study of spheral classes, because of its complexity and labor intensity, should be limited to the minimum number of them in the simplest statistical terms. This CSSS is limited to a study of spheral classes in the following four directions: economic, political, scientific, and educational. These express the appropriate qualities or profiles of the spheral classes in each sphere: 1. Economic trend in this CSSS is an analysis of the economic position of each spheral class and its participation in the economic sphere (technosphere), expressed as a volume of their private and personal economic property, including movable and immovable property, shares, securities and money savings. The dynamics of these volumes for every spheral class for 60 years, beginning since 1950, will determine the trend of economic justice/injustice in distribution of property between spheral classes in each of four countries. This trend is expressed in the spheral indices of property/havings: HP = HP1 + HP2 + HP3 +HP4, where: HP = private and personal property/havings of the Population/People (HP), HP1 = private and personal property/havings of the Socioclass, HP2 = private and personal property/havings of the Infoclass, HP3 = private and personal property/having of the Orgclass, HP4 = private and personal property/havings of the Technoclass. A unit of measure is millions of US dollars, which will require transfer of other national currencies into US dollars at the exchange rate for the respective years. We accept that, in some countries and in some of their periods, statistical data of this sort might not exist or might well be incomplete. In this case there are two possibilities: 1. Expert evaluation of these indices within the allowable 5-percent statistical error, or 2. Recording: "The data and sources to them are absent." For examples of tables for the calculation of these indices see below. 2. Political direction in this CSSS is an analysis of political representation and participation of each spheral class in the political sphere (orgsphere), including government. This participation is expressed in the number of the political elite, representing interests of each spheral class in the executive, legislative, and presidential branches of government at all levels. The political elite, which are elected and appointed officials of the executive, legislative, and presidential branches of government at all levels, is part of orgclass (P3), which, in turn, can be divided into four parts, which is employed by management of respective spheres and/or representing the interests of respective spheral classes. A few officials, managerial competence of which go over all spheres (Heads of State and Government, etc.), are part of the political elite in orgclass (P3). Here are inevitable and acceptable statistical errors, without which cannot successfully execute a proper statistical study. The dynamics of political elite of each spheral class for 60 years, beginning since 1950, will determine the trend of political justice/injustice in distribution of political power and control between spheral classes in each of the four countries. This trend is expressed by the spheral indices of the number of political elites: EP = EP1 + EP2 + EP3 + EP4, where: EP = the total number of political elite in the country as part of P3, EP1 = the number of political elite of the Socioclass, EP2 = the number of political elite of the Infoclass, EP3 = the number of political elite of the Orgclass, EP4 = the number of the political elite of the Technoclass. A relevant unit of measure is thousands of people. We accept that, in some countries and in some of their periods, the statistical data of this sort might not exist or were incomplete. In this case there are two possibilities: 1. Expert evaluation of these indices within the allowable 5-percent statistical error, or 2. Recording: "The data and sources to them are absent." Examples of tables for the calculation of these indices see below. 3. Scientific trend in this CSSS is an analysis of scientific support for each spheral class in the infosphere. This support is expressed in the number of scientists studying each sphere and providing data on the number employed in spheral classes of scientific information. Scientists bring together representatives of different sciences: humanities, social, political, legal, economic, cultural, natural, mathematics and engineering. The scientists are part of infoclass (P2), which, in turn, can be divided into four parts, each employed in research of every sphere and providing every spheral class in relevant scientific information for use in the relevant sphere. The few scientists who study all spheres of society in a relationship are part of scientists of infoclass (P2). Researchers of other spheral bonds are allocated to a priority sphere, but negligible error will be introduced in attributing them to any of the spheres being studied. The dynamics of the number of scientists for every spheral class during 60 years, beginning since 1950, will determine the trend of informational justice/injustice in distribution of scientific knowledge between spheral classes in each of four countries. This trend is expressed by the spheral indices of the number of scientists: SP = SP1 + SP2 + SP3 + SP4, where: SP = the total number of scientists in the country as part of P2 SP1 = the number of scientists for the sociosphere, SP2 = the number of scientists for the infosphere, SP3 = the number of scientists for the orgsphere, SP4 = the number of scientists for the technosphere. Again, a relevant unit of measure is thousands of people. We accept that, in some countries and in some of their periods, statistical data of this sort might not exist or might be incomplete. In this case there are two possibilities: 1. Expert evaluation of these indices within the allowable 5-percent statistical error, or 2. Recording: "The data and sources to them are absent." For examples of tables for the calculation of these indices see below. 4. Educational direction in this CSSS is an analysis of educational support of each spheral class from sociosphere (or socioclass). This support is expressed in the number of teachers of all kinds, preparing personnel with relevant education for each sphere. Teachers unite educators of different educational institutions: kindergartens, schools, colleges, universities, academies, and various educational centers. Teachers are part of socioclass (P1), which, in turn, can be divided into four parts, each employed in educational training for each sphere and each spheral class providing it appropriate education to work in relevant sphere. Numerous teachers, providing common training for all spheres of society in pre-schools and secondary schools, are part of the teachers of socioclass (P1). Here there are inevitable and acceptable statistical errors. The dynamics of the number of teachers, for each spheral class during 60 years, beginning since 1950, will determine the trend of educational justice/injustice in distribution of educational services between spheral classes in each of four countries. This trend is expressed by the spheral indices of teachers’ number: TP = TP1+ TP2 + TP3 +TP4, where: TP = total number of teachers of the country as part of P1, TP1 = the number of teachers training staff of Socioclass, TP2 = the number of teachers training staff of Infoclass, TP3 = the number of teachers training staff of Orgclass, TP4 = the number of teachers, training staff of Technoclass. Again, a relevant unit of measure is thousands of people. We accept that, in some countries and in some of their periods, statistical data of this sort might not exist or might be incomplete. In this case there are two possibilities: 1. Expert evaluation of these indices within the allowable 5-percent statistical error, or 2. Recording: "The data and sources to them are absent." For examples of tables for the calculation of these indices see below. 11. A Single Research Complex of Statistical Indices for Each Country and Common Content of Report on them The CSSS statistical task for each country is identical. only the identity of statistical indices and research purposes will provide them with full-scale comparability and comparability across countries. The single statistical task of CSSS for each country is expressed in the following single complex of statistical research objectives and indices, combined in the following paragraphs of the report: 1. Paragraph 1: "Number of Spheral Classes of the Country Population." In this measure, the spheral indices are calculated by statistical formula: P = P1 + P2 + P3 + P4 in Table 1 (above). This paragraph consists of 7 sub-paragraphs of the same name on each of the seven decades with relevant tables, lists of sources and statistical comments – a report of up to 17 pages, + summarizing sub-paragraph: "Dynamics of Spheral Classes of the Country Population for 60 years," with a table and graph of their dynamics in all 7 decades and the dynamic comment - up to 3 pages of the report. The total is up to 20 pages. 2. Paragraph 2: "Private and Personal Property of Spheral Classes of Country." In this measure, the spheral indices are calculated by statistical formula :HP = HP1 + HP2 + HP3 +HP4 in Table 2 (below). This section consists of 7 sub-paragraphs of the same name on each of the seven decades with relevant tables, list of sources and statistical comments -a report of up to 8 pages, + summarizing sub-paragraph "Dynamics of Private and Personal Property of Spheral Classes of Country for 60 years," with a table and graph of their dynamics by all 7 decades and the dynamic comment - up to a 2-page report. The total is up to 10 pages. Table 2. Private and Personal Property of Spheral Classes of Country in billions of US dollars Spheral Indices | Private and Personal Property | 1950 | 1960 | 1970 | 1980 | 1990 | 2000 | 2010 | HP | Private and Personal Property of the country population: HP = HP1 + HP2 + HP3 + HP4 | | | | | | | | HP1 | Private and Personal Property of Socioclass | | | | | | | | HP2 | Private and Personal Property of Infoclass | | | | | | | | HP3 | Private and Personal Property of Orgclass | | | | | | | | HP4 | Private and Personal Property of Technoclass | | | | | | | |
All in Table 2 are 5 indices. 3. Paragraph 3: "Political Elite of Spheral Classes of Country." In this measure, the spheral indices are calculated by statistical formula: EP = EP1 + EP2 + EP3 + EP4 in Table 3 (below). This section consists of 7 sub-paragraphs of the same name on each of the seven decades with relevant tables, list of sources and statistical comments - a report of up to 8 pages, + summarizing sub-paragraph: "Dynamics of Political Elite of Spheral Classes of Country for 60 years," with a table and graph of their dynamics by all 7 decades and the dynamic comment - up to 2-pages report. The total is up to 10 pages. Table 3. Political Elite of Spheral Classes of Country in thousands of people Spheral Indices | Number/Quantity | 1950 | 1960 | 1970 | 1980 | 1990 | 2000 | 2010 | EP | Political Elite of Country: EP = EP1 + EP2 + EP3 + EP4 | | | | | | | | EP1 | Political Elite of Socioclass | | | | | | | | EP2 | Political Elite of Infoclass | | | | | | | | EP3 | Political Elite of Orgclass | | | | | | | | EP4 | Political Elite of Technoclass | | | | | | | |
All in Table 3 are 5 indices. 4. Paragraph 4: "Scientists Serving Spheral Classes of Country," or shorter: "Scientists for Spheral Classes of Country." In this measure, the spheral indices are calculated by statistical formula: SP = SP1 + SP2 + SP3 + SP4 in Table 4 (below). This section consists of 7 sub-paragraphs of the same name on each of the seven decades with relevant tables, list of sources and statistical comments -a report of up to 8 pages, + summarizing sub-paragraph: "Dynamics of Scientists for Spheral Classes of Country for 60 years," with a table and graph of their dynamics by all 7 decades and the dynamic comment - up to a 2-page report. The total is up to 10 pages. Table 4. Scientists for Spheral Classes of Country in thousands of people Spheral Indices | Number/Quantity | 1950 | 1960 | 1970 | 1980 | 1990 | 2000 | 2010 | SP | Scientists of Country: SP = SP1 + SP2 + SP3 + SP4 | | | | | | | | SP1 | Scientists for Socioclass | | | | | | | | SP2 | Scientists for Infoclass | | | | | | | | SP3 | Scientists for Orgclass | | | | | | | | SP4 | Scientists for Technoclass | | | | | | | |
All in Table 4 are 5 indices. 5. Paragraph 5: "Teachers of Spheral Classes of Country." In it, its spheral indices are calculated by statistical formula: TP = TP1 + TP2 + TP3 +TP4 in Table 5 (below). This section consists of 7 sub-paragraphs of the same name on each of the seven decades with relevant tables, list of sources and statistical comments - up to 8-pages report; + summarizing sub-paragraph: "Dynamics of Teachers of Spheral Classes of Country for 60 years," with a table and graph of their dynamics by all 7 decades and the dynamic comment - up to a 2-page report. The total is up to 10 pages. Table 5. Teachers of Spheral Classes of Country in thousands of people Spheral Indices | Number/Quantity | 1950 | 1960 | 1970 | 1980 | 1990 | 2000 | 2010 | TP | Teachers of Country: TP = TP1 + TP2 + TP3 + TP4 | | | | | | | | TP1 | Teachers of Socioclass | | | | | | | | TP2 | Teachers of Infoclass | | | | | | | | TP3 | Teachers of Orgclass | | | | | | | | TP4 | Teachers of Technoclass | | | | | | | |
All in Table 5 are 5 indices. As a whole, the content of statistical report for each country should include the following paragraphs, including 27 spheral indices for each decade: 1. Number of Spheral Classes of the Country Population in 1950-2010 – 7 indices. 2. Private and Personal Property of Spheral Classes of Country in 1950-2010 – 5 indices. 3. Political Elite of Spheral Classes of Country in 1950-2010– 5 indices. 4. Scientists for Spheral Classes of Country in 1950-2010– 5 indices. 5. Teachers of Spheral Classes of Country in 1950-2010– 5 indices. The total is 189 indices for 7 decades for each country. Each of these 5 sections contains 7 sub-paragraphs for each of the seven decades and one summarizing sub-paragraph - a total 40 sub-paragraphs of the report, with a total length up to 60 pages and no less than 50 pages. These are the content and volume of research work within CSSS. The fulfillment of this basic research on each country is assigned to each country's statisticians. Every statistician should prepare a report on the country in accordance with this specified content up to 60 pages (text requirements and page size see below). In general, the statistical part of CSSS (and related book) for four countries will be no more than 240 pages. 12. CSSS General List of 27 Spheral Indices with Decoding of their Acronyms
In the CSSS all spheral indices are expressed in alphanumeric abbreviations/acronyms that require decoding in their full title. CSSS is limited by 27 spheral indices that are defined above. The consolidated list in the abbreviations and full titles is presented in the following table. Table 6. List of 27 Spheral Indices of CSSS № | Acronyms | Full Title of Indices | Formulas | -
| P | All Population of any Country: | P = P1 + P2 + P3 + P4 | -
| P1 | Socioclass of any Country | P1 = P1w + P1s | -
| P1w | P1w = sum of employed in branches of sociosphere | | -
| P1s | P1s = sum of self-employed (non-working population) of sociosphere | | -
| P2 | Infoclass of any Country = sum of employed in branches of infosphere | | -
| P3 | Orgclass of any Country = sum of employed in branches of orgsphere | | -
| P4 | Technoclass of any Country = sum of employed in branches of technosphere | | -
| HP | Private and Personal Property of the Country Population | HP = HP1 + HP2 + HP3+HP4 | -
| HP1 | Private and Personal Property of Socioclass | | -
| HP2 | Private and Personal Property of Infoclass | | -
| HP3 | Private and Personal Property of Orgclass | | -
| HP4 | Private and Personal Property of Technoclass | | -
| EP | Political Elite of any Country | EP = EP1 + EP2 + EP3 + EP4 | -
| EP1 | Political Elite of Socioclass | | -
| EP2 | Political Elite of Infoclass | | -
| EP3 | Political Elite of Orgclass | | -
| EP4 | Political Elite of Technoclass | | -
| SP | Scientists of any Country: | SP = SP1 + SP2 + SP3 + SP4 | -
| SP1 | Scientists for Socioclass | | -
| SP2 | Scientists for Infoclass | | -
| SP3 | Scientists for Orgclass | | -
| SP4 | Scientists for Technoclass | | -
| TP | Teachers of any Country | TP = TP1 + TP2 + TP3 + TP4 | -
| TP1 | Teachers of Socioclass | | -
| TP2 | Teachers of Infoclass | | -
| TP3 | Teachers of Orgclass | | -
| TP4 | Teachers of Technoclass | |
In the CSSS reports, abbreviations of the spheral indices use only with this table. It is possible that not all of the CSSS 27 spheral indices are expressed in the statistics of some countries or in its different periods. In this case, they can be expressed as statistical estimates of the experts or go without quantification. But the experts have to use all the statistical possibilities of any reliable sources of data to ensure formation of these 27 spheral indices. Total into Tables 1-5 are presented 54 statistical indices, from which we derive 27 spheral indices. The task of each expert-statistician of each country is to fill five tables and comment on their statistical content, its features and problems (if they will be) and to present all of these materials in the appropriate report within a specified time to the CSSS Editor in Chief. Statisticians will solve problems, associated with these tables and reports with him interactively through e-mail. 13. Sample of Statistical Data for Spheral Classes and their Qualities The observed sample of statistics for indices of spheral classes and their qualities is defined on the basis of state statistical reports for seven decades: 1950, 1960, 1970, 1980, 1990, 2000, 2010 and, on the basis of the relevant additional studies in four countries, with help and through formulas and tables of spheral indices presented in this CSSS Program (see above). I.II. Analysis 14. Analysis: Comparison and Conceptual Interpretations. List of Scientists The CSSS analytical part includes two pieces: comparative and conceptual. The CSSS Comparative part includes the integral/summary comparisons of dynamics of spheral classes and their qualities together with the relevant tables and graphs for the four countries in the articles of up to 5 pages with the following approximate names: - Comparison of Dynamics of Spheral Classes of the Population in 4 countries for 1950-2010 and its Conclusions for Global Social Structure and Global Sociology. - Comparison of Dynamics of Economic Position and Justice/Injustice of Property Distribution among Spheral Classes in four Countries during 1950-2010 and its Conclusions. - Comparison of Dynamics of Political Elites of Spheral Classes in four Countries during 1950-2010 and its Conclusions. - Comparison of Dynamics of Number of Teachers, Training Staff for Spheral Classes, in four Countries during 1950-2010 and its Conclusions. - Comparison of Dynamics of Number of Scientists Serving the Spheral Classes in four Countries during 1950-2010 and its Conclusions. The CSSS Conceptual part, its content and articles are determined after the comparative part of SSSI.
15. CSSS Conclusion CSSS Conclusion is the outline of a wide range of consequences and outputs fromthis study in the following scientific and practical ways of the 21st century: - Formation of a scientific theory of global social structure in the framework of global sociology, - Development of global sociology as a scientific theory of global harmony and harmonious civilization, - Laying the foundation of global spheral statistics based on a traditional (branch) statistics - Construction of scientific theory of global harmonious and just economy, - Dissemination of CSSS to other countries, - Using CSSS in national governments and international organizations to solve global and national development challenges, especially for world peace, - Extrapolation of the CSSS findings to global population, - Significance of fundamental empirical knowledge about trends/laws of spontaneous social and economic harmony and disharmony for understanding how to transfer them into a conscious and controlled channel, - Scientific projecting of social harmony and harmonious just economy at all levels, - Formation of a common scientific platform for global harmonious education including interfaith harmony education at all levels, - Formation of a common scientific platform for global harmonious political democracy together with a global constitution at all levels, - Construction of sociocybernetic models of national social genomes (Socionomes – see the ABC of Harmony, pp 40-41) of the four countries in their dynamics during 60 years in spheral indices with the subsequent construction of a similar cybernetic model for global Socionome, etc. 16. Presentation of CSSS Results: Reports, Graphics, and etc. The CSSS results will be presented in statistical reports and analytical articles. The Statistical Reports will be reports of statisticians on spheral indices of each country. These reports are limited to statistical information with its comparisons and generalizations (see above). Analytical articles covering comparative and conceptual commentaries and interpretations. The CSSS results will be presented in different content forms, but will be similar in appearance and requirements. 1. The first, basic form will be the use of spiral indices tables. As defined above, for each country, five identical types of tables with 27 spheral indices will be formed. The form of these tables is given above. It is the same for all countries and for all statistical reports, ensuring their comparability across countries. 2. The second form will be comparative graphs of dynamics of spheral classes and their attributes within each country for period 1950-2010 in the following form: Graph 1 Dynamics of Spheral Classes of the Population in India (or other country) for 1950-2010 in millions of people. M. People | | | | | | | | Trends | 1200 | | | | | | | | 1 – Total population | 1000 | | | | | | | | | 800 | | | | | | | | 2-Socioclass | 600 | | | | | | | | 3-Infoclass | 400 | | | | | | | | 4-Orgclass | 200 | | | | | | | | 5-Technoclass | 100 | | | | | | | | | YEARS: | 1950 | 1960 | 1970 | 1980 | 1990 | 2000 | 2010 | |
Similar graphs will be built for other spheral indices, as well as graphics of dynamics of global social structure in sum of spheral classes for four countries and for qualities of these classes. 3. All of the CSSS texts are prepared for publication in the book, so they are subject to high and similar requirements in the following list: their list will be published if necessary. 17. Publication of CSSS Results in Book The CSSS results will be published as a separate book in two languages simultaneously: English and Russian. Therefore, the CSSS authors of reports and articles make them with this in mind as the authors of this book. Preparation of the book in the original layout is done by the editor/manager. In Russian, the book will be published in Russia, St. Petersburg. The English language book will be published in the United States or India, depending upon the optimal conditions in one or another country. The book’s tentative title is: Global Social Structure: Dynamics of Spheral Classes of the Population in India, USA, Russia and Kazakhstan in 1950-2010. Key Condition for World Peace, Social Harmony and Economic Justice. 18. CSSS List of Literature The CSSS list of scientific literature is compiled from the statistical sources of 4 countries for 1950-2010 and other literature used in reports and scientific articles by its authors. As example, see Dr. Leo Semashko’s and the GHA coauthors’ list of books below, in which is the theoretical development of concept "spheral classes of the population" (SPHERONS) and their spheral statistical indices as the key for CSSS. - 2012. The ABC of Harmony for World Peace, Harmonious Civilization and Tetranet Thinking.Together with the GHA 75 coauthors from 26 countries. Global Textbook. GHA 34th Project. First published in English in India, New Delhi, Doosra Mat Prakashan, 2012, pages ~334. ISBN – 978-81-923108-6-2: http://peacefromharmony.org/?cat=en_c&key=478
- 2010. Russia, Forward, towards Harmonious Civilization. Together with the GHA co-authors. St. Petersburg, LITA, 30 pages, in Russian: http://peacefromharmony.org/?cat=ru_c&key=435
- 2010. Kazakhstan - Harmonism Strategy for the 21st century. GHA project for the President and the Parliament of Kazakhstan. Together with the GHA 14 co-authors from 10 countries. St. Petersburg, LITA, 22 pages, in Russian and English: http://www.peacefromharmony.org/?cat=en_c&key=445
- 2009. Harmonious Civilization. Global Harmony Association Innovative Projects, with the GHA 119 coauthors from 34 countries, in 2 languages. St-Petersburg, Russia, LITA, pages 254: http://peacefromharmony.org/?cat=en_c&key=379,
- 2008. World Harmony/Peace Academy and General Harmonious Education in an Information Society, with the GHA 64 coauthors from 20 countries, in 2 languages. St-Petersburg, Russia,"LITA ", pages 104. http://peacefromharmony.org/?cat=en_c&key=277
- 2007. Magna Carta of Harmony for an Information Civilization: Toward Social Justice and Global Peace, with the GHA 42 coauthors from 16 countries in 7 languages, LITA, 228 p. http://www.peacefromharmony.org/?cat=en_c&key=3
- 2006. Harmonious Era Calendar: Address to Children, Youth and Future Generations, withthe GHA 26 coauthors from 12 countries in 12 languages, St.-Petersburg State Polytechnic University, 396 p. http://www.peacefromharmony.org/?cat=ru_c&key=190
- 2004. Children’s Suffrage: Democracy for the 21st Century, Priority Investment in Human Capital as a Way toward Social Harmony, St.-Petersburg State Polytechnic University, 72 p. http://www.peacefromharmony.org/?cat=en_c&key=211
- 2003. Tetrasociology: from Sociological Imagination through Dialogue to Universal Values and Harmony, with 14 co-authors, in three languages: Russian, English and Esperanto. St.-Petersburg State Polytechnic University, 394p. http://www.peacefromharmony.org/?cat=en_c&key=149
- 2002. Tetrasociology: Responses to Challenges. St.-Petersburg State Polytechnic University (in Russian and English), 158 p. http://www.peacefromharmony.org/?cat=en_c&key=145
- 2000. Tetrasociology as the Revolution of Social Thinking, the Way of Harmony and Prosperity. St.-Petersburg, 168 p. (in Russian)
- 1999. Sociology for Pragmatists. Textbook for the university students. Part 1, St.-Petersburg, 376 p. (in Russian)
- 1992. Sphere Approach: Philosophy, Democracy, Market and Human. St.-Petersburg, 368 p. (in Russian)
Note. Some of these books have found a response in the reviews in "International Sociology" (v.22, № 2, March 2007, p. 164-168, etc.), other international journals, as well as a presentation on all ISA Congresses since 2002 and Congress of the International Institute of Sociology in Beijing in 2004. The topics of these books, especially the spheral classes, are reflected in a few articles by the author in domestic sociological journals: "Telescope" (journal of Sociology, St. Petersburg), "Sociological Studies", as well as in numerous articles on the GHA website "Peace from Harmony" since 2005: www.peacefromharmony.org. The SSSI organization will be determined as needed. 2.10. Perspectives and Significance of Global Spheral Statistics This chapter proposed a methodology of statistical and empirical study of SPHERONS and also problems of war and peace in global spheral statistics. This methodology is innovative with an unlimited range of applications and with colossal social and economic implications. Using this methodology, each peace organization in the world, including the United Nations and UNESCO, and every government can explore the dynamics of SPHERONS in any city, any institution, any country and worldwide to determine the disharmonies that are sources of potential or emerging wars and armed conflicts. These organizations and governments can then explore the dynamics of priorities of peace and war in any region. They can build simulation models of any region to investigate the level of military risks and threats in each of them and their dynamics, etc. A field of application of these scientific peace instruments is indefinite and open to all governments and leaders who want peace in reality, not in empty rhetoric. This is the main value of global statistics for peace. Its essence lies in the fact that the global statistics can only be determined through the spheral statistics, based not on the variable, local and temporary branches but on the permanent and universal spheres and SPHERONS. The use of universal spheres and SPHERONS are key features that provide a unique advantage of an innovative global statistics, which is universal and the same for all countries and continents. In traditional statistics, the spheres of activity (life, production and society) practically do not count. This main weakness and limitation of traditional statistics can be found expression in the famous aphorism of the late 19th century attributed to British Prime Minister Benjamin Disraeli (1804-1881): “There are three kinds of lies: lies, damned lies, and statistics.” The investigated social structure of SPHERONS as universal at all levels: school, city, country and the world is an immutable law. Any, even the smallest organization, has a similar universal structure even if some spheral functions are combined in one person or many persons. Of this structure, there are no exceptions. All schools, colleges, universities and companies are identical in the global social structure of SPHERONS or spheral classes, without the participation of at least one they do not exist. Their harmony within each organization provides peace within it.The people within these organizations all work in a manner of peace from harmony, but when a private conflict or disharmony arises in any part of the organization, then its activity is temporarily stopped; a good example of this is a dispute between workers and managers that results in a work stoppage or strike. The different enterprises and organizations might be seen as very different and maybe even as little or no comparable on traditional statistical measurements with branches, branch structure and indices. But with the social spheral structure of SPHERONS and relevant statistics, the branches are then viewed as comparable and compatible, without exception. This fact opens up colossal scientific and practical opportunities for improved management, forecasting, planning, cooperation and development of each branch, each organization and each country on the path of conscious (scientific) global peace that is most effective for all. The ABC of Harmony and GPS offer a single, common to all countries the spheral classification of employment by SPHERONS providing, together with other conditions, unity, harmony and peace to all nations. Our research in this direction, as explained in the second chapter, is only the first and very modest step in this path of truth and prosperity. Our main task was to prove SPHERONS as significant and beneficial actors of global peace from harmony. This task is done. The work is in the minimum but enough to convince us and others in the objective existence of SPHERONS, the discovery of which means the beginning of a new era of social science and a more knowledgeable society. The first government, which will start and implement the first such studies, will also be the first to, in the words of Martin Luther King, Jr., “shift the arms race into a peace race.” This government will arm themselves with innovative knowledge that will provide its country – and the rest of the world – with unique economic and social preferences. This social knowledge will be more powerful than any war weapons. In conclusion, we emphasize the following. As we know, the theory and its empirics (empirical basis of the theory) are two necessary conditions of any science. GPS answers them, so it is a full-fledged science. To refute it, two conditions are necessary: 1. Logical destruction of its theory and 2. Disproving its facts. For 40 years the idea of spheral classes, SPHERONS, which is the backbone of GPS, no any scientist has presented neither the one nor the other. This idea is clear, though, of course, SPHERONS is not the easiest thing, as well as Einstein's physics compared with Newtonian physics. New science requires new learning and new, global peace education in GPS since childhood, as will be discussed below.
Conclusion. Significance of Global Statistics of SPHERONS for Peace. The knowledge of quantitative statistical dynamics of structural proportions of social harmony of SPHERONS at all levels from local to global provides a scientific method of control, governance and building global peace at these levels that will simultaneously preventing any armed conflicts and wars. This is expressed by the following chain of concepts and tetra-model: 1.Global statistics of SPHERONS - 2.Control of harmony proportions - 3.Governance of dynamic proportions - 4.Building global peace Model-5. Global Statistics of SPHERONS for Peace
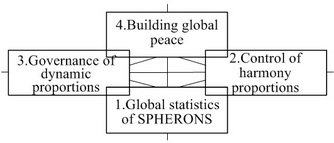
Without a global, common to all countries statistics of SPHERONS global peace is impossible. Dr. Leo Semashko and GHA coauthors May 15, 2014
Up
|
 Official Website")