| |
Spherons: Global Peace Genetics of the XXI century. International Spheral Statistics: GlobStat (GS).
For "The Great Peace Charter XXI" Victory: http://peacefromharmony.org/?cat=en_c&key=834
Digital technology of the XXI century:
Spheral Information-Statistical Technology (SIST)
On the GS foundation. The XXI century Axiom:
Without GS and SIST, the world's digital harmonious economy and global peace in it are impossible. The XXI century Trend:
Spheral science and statistics - digital technology - digital economy - global peace –
spherons’ planetary harmonious noospheric civilization. The XXI century ABC/Paradigm of Tetranet Thinking:
Sociocybernetic harmonious holistic thinking by spheres and spherons’ structural harmony of social production on all levels from family and country to humanity as a whole.
About similar level of thinking for humankind dreamed 70 years ago Albert Einstein,
if "it wants to survive":
(http://peacefromharmony.org/?cat=en_c&key=824) Publication: In English: http://peacefromharmony.org/?cat=en_c&key=836 In Russian: http://peacefromharmony.org/?cat=ru_c&key=783 The GHA articles list on spherons’ statistics and its methodology.
Published below:
1.Leo Semashko and Olga Kashina (2018) Global Peace Genetics: Structural Harmony of Russia’s Spherons in their Statistics for 2010, 1996 и 1991. 2.Stephen Amoah and Ayo Ayoola-Amale (2018) Global Peace Science: Structural Harmony of Spherons and Statistics of Ghana’s Spherons for 2010, 2000 and 1984. 3.Leo Semashko (2018) Ghana: A scientific breakthrough in the statistical research of Spherons. 4.Olga Kashina (2018) Statistics of the Spherons population in Russia for 2002 - in work 5.Spherons of Pakistan (2018) - in work 6.Spherons of India (2018) - in work 7.Olga Kashina and Leo Semashko (2014) Statistics of SPHERONS of Russia for 2010: Methodology, Sources and Number: http://peacefromharmony.org/?cat=en_c&key=593 8.Olga Kashina (2014) Statistics of SPHERONS of St. Petersburg in 2010: Number. http://peacefromharmony.org/?cat=en_c&key=593 9.Svetlana Kuskovskaya, Habyarimana Heli, Maitreyee Roy, Maria Azcona, Leela Pradhan, Ammar Banni (2014) Statistical Study of SPHERONS of Educational Institutions in Russia, Rwanda, India, Argentina, Nepal and Algeria: http://peacefromharmony.org/?cat=en_c&key=593 10.Leo Semashko (2002) The number of spheral classes in Russia in 1991 and 1996 (In the book: Tetrasociology: Responses to Challenges, 2002, pp. 45-49 or 69-73): http://peacefromharmony.org/docs/2-1_eng.pdf or: http://www.peacefromharmony.org/?cat=en_c&key=180 ---------------- Methodology and Program of
Statistical Research of Spherons: http://peacefromharmony.org/?cat=en_c&key=593
1.Leo Semashko and 18 GHA members from 10 countries (2014) Dynamics of SPHERONS of Russia, India, USA and Kazakhstan in 1950-2010 for decades. The Program of Comparative Sociological Statistical Research (SSSI): http://peacefromharmony.org/?cat=en_c&key=593 2.Leo Semashko and 18 GHA members from 10 countries (2014) Program of Statistical Study of SPHERONS of Educational Institutions http://peacefromharmony.org/?cat=en_c&key=593 3.Leo Semashko, Ivan Ivanov (2014) Monitoring: Dynamics of Peace and War Priorities in World Public Consciousness in 2014 in the Internet: http://peacefromharmony.org/?cat=en_c&key=593 ---------------------------------------------------------------------
Leo Semashko books, in which special sections are devoted to spheral statistics and technology:
1.2016. Global Peace Science: http://peacefromharmony.org/docs/global-peace-science-2016.pdf
2.2015. Global Peace Science: Russian: http://peacefromharmony.org/?cat=ru_c&key=606 - 2012. The ABC of Harmony for World Peace: http://peacefromharmony.org/?cat=en_c&key=478
- 2009. Harmonious Civilization: http://peacefromharmony.org/?cat=en_c&key=379,
- 2008. World Harmony/Peace Academy: http://peacefromharmony.org/?cat=en_c&key=277
- 2007. Magna Carta of Harmony for an Information Civilization: http://www.peacefromharmony.org/?cat=en_c&key=3
- 2003. Tetrasociology: from Sociological Imagination: http://www.peacefromharmony.org/?cat=en_c&key=149
- 2002. Tetrasociology: Responses to Challenges. http://www.peacefromharmony.org/?cat=en_c&key=145
- 1999. Sociology for Pragmatists (in Russian): http://peacefromharmony.org/docs/sociologiya-dlya-pragmatikov.pdf
10.1992. Sphere Approach: Philosophy, Democracy, Market and Human:
http://peacefromharmony.org/docs/leo-semashko-spheral-approach-1993.pdf
-----------------------------------------------------------------------------------
1. Global Peace Genetics: Structural Harmony of Russia’s Spherons in their Statistics For 2010, 1996 и 1991 By Leo Semashko and Olga Kashina Abstract: John F. Kennedy at the UN Session 55 years ago formulated the absolute truth of modernity: "Humanity must end the war before the war puts an end to humanity." Unfortunately, the following questions remain unanswered: "Who, How, at What level and When will put an end to war?" The first attempt to give a scientific answer to these questions is proposed in the sociocybernetic "Global Peace Science" created in the GHA by efforts of 174 its co-authors (including several Nobel Peace Laureates and the Indian President) from 34 countries during 11 years of persistent teamwork. The formula of this science answer is simple: "The conscious peace from spherons’ structural harmony excludes war." It means that the end of war and militarism can be put only at the genetic level of the structural harmony of spherons’ global peace. Spherons are the population deepest stochastic structural classes / communities, employed in the four spheres of social production as the eternal and continuous social "autopoiesis" (self-production, H. Maturana) of humankind. The discovery of spherons has been proved in the GHA and now it is constantly proved by statistical researches in different countries, the number of which is growing. In our paper, the results of a statistical research of Russian spherons dynamics for 2010, 1996 and 1991 based on population censuses and other statistics are presented. The evidences from other countries are presented in similar researches from Ghana, India, Nigeria and Pakistan.
These innovative international researches of spherons are exclusively important for the development of a fundamental scientific theory of global peace and for the renewal of paradigmatic peace education in the 21st century in order to “end the war before the war puts an end to humanity.” Keywords: spherons, global peace, social harmony, global peace science, spherons theory, national statistics of spherons, global peace genetics Contents 1.Tasks of Research 2.Definition of the SPHERONS and their Sociocybernetic Genome (SOCIONOME) 3.Spheral Indices of the SPHERONS 4.Sources of Statistics on Employment and Unemployment of the Population in Russia 5.Classification by Branches of Economic Activity and Categories of Personnel 6.Technique of Definition of Number of Russia SPHERONS Based on Statistics 7.Mid-year Population of the Russian Federation for 2010 8.Definition of Number of Non-working Population (P1n) in Russia for 2010 9.Number of SPHERONS in Russia for 2010 10.Number of SPHERONS in Russia for 1991 and 1996 11.Conclusion: Problems and Significance of the Study 12.References 1. Tasks of Research
The purpose of our statistical research is to define the numerical distribution of the population in Russia on the spheral classes, SPHERONS, for 2010, 1996 and 1991. To achieve this purpose in our work we solved the following tasks:
·Formed the definition of SPHERONS (spheral classes of the population); ·Formed the SPHERONS classification and their spheral indices; ·Created the technique of determining the number of SPHERONS in Russia based on statistics of the population of Russia; ·Examined the sources of statistics on employment and unemployment of the population of Russia; ·Reviewed classifications by the branches of economic activity and categories of personnel used in Russia currently; ·Collected data characterizing employment by the branches of economic activity, categories of personnel and non-working population; ·Conducted grouping of the Russian population by SPHERONS for 2010, 1996 and 1991, which are expressed in their final tables of number. The study signification is defined by the fact that people/population who constitute SPHERONS are the main productive force of society and are a priority social resource that produces all other resources of society, including the population itself. Therefore, the employment statistics of Spherons is especially important for the conscious regulation of their genetic structural harmony, which excludes imbalances, disharmonies, crises and armed conflicts, hence ensuring sustainable peace and prosperity at the national and global levels. 2. Definition of the SPHERONS and their Sociocybernetic Genome (SOCIONOME)
“SPHERONS” or “spheral classes of the population” are the extremely large groups of people covering them in a whole and employed in four spheres of social production of PIOT resources (People, Information, Organization, Things). They are differ on the main (on time) employment in one of the four spheres [5, 70]. The Spherons most complete and detailed theoretical analysis is presented in the GHA fundamental book: "Global Peace Science", in Chapter 1 [6a, 21-51].
Four spheres of production are: 1.Social sphere, or Sociosphere (S), the subject and product of which are people (P); 2.Information sphere, or Infosphere (I), the subject and product of which is information (I); 3.Organizational sphere or Orgsphere (O), the subject and product of which are organization, management, politics, law, finance, defense, etc. (O); 4.Technical (economic/environmental) sphere, or Technoecosphere (T), the subject and product of which are things, including all material goods and services (T). Together, they are called SIOT-spheres. Four SPHERONS, spheral classes, employed in these spheres SIOT are: 1.SOCIOCLASS, people employed in Sociosphere, subject and product of this class are P; 2.INFOCLASS, people employed in Infosphere, subject and product of this class is I; 3.ORGCLASS, people employed in Orgsphere, subject and product of this class is O; TECHNOCLASS, people employed in Technoecosphere, subject and product of this class are T. See also [6, 33–43]. Together, they are called SIOT-classes/Spherons.
SOCIONOME. Four social spheral resources of PIOT, produced by the corresponding four Spherons in the corresponding four spheres of production, uniting the corresponding four processes: production, distribution, exchange and consumption constitute a social and, more precisely, a sociocybernetic genome, succinctly: SOCIONOME. It is a general and constant for all societies and at all levels sociocybernetic because it represents an integral nonlinear system of direct and inverse, regulating, stochastic cybernetic interactions/feedbacks within the framework of a holistic self-organizing structural harmony of spheres and spherons of social production of any form and any level. The nonlinear, stochastic and thermodynamic nature of spherons in the global peace genetics is disclosed here [6g]. Its driving energy, productive force, motor, heart and blood are spherons that ensure the preservation of its genetic structural harmony and the development of its endless forms in social evolution. It is the genome of sustainable development and long life, social "autopoiesis" according to H. Maturana, of human society as a species of living nature. It excludes wars and any self-destruction by definition, which can only be partial and temporary genetic pathologies of some local societies that either die naturally, or are cured from them in the same natural way. Therefore, SOCIONOME is the genome of global peace and its genetic code, which remains constant in all the diversity of its endless sociocultural forms in the historical evolution of the human species. Only peace possesses the genome and genetics, the war is deprived of it and represents only its partial and temporary pathology as a certain crash or breakage in its structural cybernetic harmony of spheres and spherons of social production. The discovery and development of the sociocybernetic theory of spherons and their genome continues for more than 40 years. This occurred in the mainstream of tetrasociology as third-order sociocybernetics (sociocybernetics of spheres and spherons of social production) and is represented in a variety of scientific works, of course, in the most complete and perfect form in recent books [6; 6a]. The shortest last description of the sociocybernetic genome is here: [6b]. The theory of spherons and their genome constitutes the genetics of global peace, which becomes accessible to conscious regulation only if there is appropriate scientific knowledge, its digital technologies and the corresponding sociogenic engineering of controlling and repairing certain parts of the socionome in its particular militaristic pathologies. Only genetically peacebuilding spherons, which scientifically aware of their own peace genetics, are capable to put an end to wars and militarism. only they are able to do this nonviolently, at an adequate genetic level, scientifically managing their structural harmony, in order to prevent and eliminate any causes of wars. Therefore, to end the war, humanity will be able only to master the global peace genetics in the structural harmony of its spherons. Schematically, the sociocybernetic genome of the structural harmony of spherons’ global peace is represented as follows. Scheme. Sociocybernetic GENOME of Spheres and Spherons’ Structural Harmony 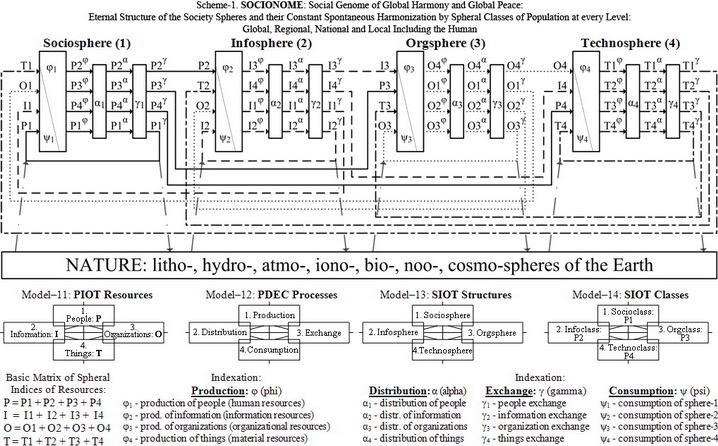
More details on SOCIONOME see [The ABC of Harmony for World Peace, 38-43] and Video: http://youtu.be/hbxY5lREOeA It is obvious that the key role in the socionome among its 16 fundamental elements belongs to the Spherons who constantly reproduce it as bees in the swarm processes, therefore their statistical research at all levels, especially at the national level, is crucial for establishing peace in each country, and hence at the global level. only to this research is devoted our work. 3. Spheral Indices of the SPHERONS
SPHERONS, as a whole, and the individuals who make them differ by main (on time) employment in one of the four spheres of society. (Employment of SPHERONS was discussed in more detail in the first chapter, paragraph 1.6. [6a]). Employment defines each person’s universal life characteristics from birth to death. All other qualities of people, on which they differ, such as labor, property, power, education, and the like, are its partial manifestations and/or products. All the time within people’s lives is devoted to production of various social resources, including and above all, the continuation of life for themselves. Within multidimensional topology of vital employment of people are distinguishedits two principal clusters:
1. Self-production or ‘autopoiesis’ is employment of each person by own himself (“I”) from birth to death in processes such as eating, sleeping, sex, hygiene, learning, communication, recreation, healing, etc. The term self-production (autopoiesis) was first introduced by Humberto Maturana and Francisco Varela (1973) for theoretical biology to describe the self-reproduction of living cells [6e]. In 1990, this term was reinterpreted in sociology by Niklas Luhmann to describe characteristics of human communication as a key element of social system [6f]. Autopoiesis belongs to Sociosphere because it includes all kinds of human activity except economic/labor/working activity, which stands out in a separate cluster of employment. 2. Labor/work or economic employment of people by other resources except own “I”. As a rule, this is formally established within norms of labor activity of society. The labor activity is a part of self-production known as “seniority (work experience)” or “experience of labor activity.” It is part of each person’s life. These two clusters of employment divide the entire population into two parts: 1.Nonworking (economically inactive) population employed in Sociosphere by self-production. 2.Working or economically active population employed in all spheres. The task of this research is to determine the number of each SPHERON of Russia in the specified years and compare them among themselves in order to understand their dynamics and trends over time. For this purpose, the following spherons spheral indices are introduced. The spheral indices, which are used to express Spherons, are defined as follows:
Table 1. Spherons’ spheral indices
P | Population/people in general for any level and any community from family, school and town up to country and the world. | P1 | Socioclass, Spheron-1, who are employed in the branches of sociosphere (first sphere); | P1n | Non-working population, who are employed in self-production (‘autopoiesis”, Maturana [10])of sociosphere and forming the Spheron-1first part; | P1w | Working population in the branches of Sociosphere and who constitute the Spheron-1 second part. Therefore, P1 = P1n + P1w; | P2 | Infoclass, Spheron-2, who are employed in branches of Infosphere (second sphere); | P3 | Orgclass, Spheron-3, who are employed in branches of Orgsphere (third sphere); | P4 | Technoclass, Spheron-4, who are employed in branches of Technosphere (economic, fourth sphere). |
Each spheral class is a separate SPHERON covering part of the population employed in one of the four spheres of social production. In sum, the number of people of the four SPHERONS is the total population. This is expressed by the formula: P = P1 (P1n + P1w) + P2 + P3 + P4 or Population/People=Spheron-1 (nonworking + working in this sphere) + Spheron-2 + Spheron-3 + Spheron-4. This is the fundamental formula of the population/people of any community from the family, town, and country to humanity as a whole in the Spherons’ spheral indices. The principal advantage and excellence of the spheral indicators is that they ensure the global digitalization of all national statistical indices, constitute their common denominator, logically organize/systematize/integrate them and open the way for the digital economy, for digital global peace through digital/conscious prevention of all wars and nonviolent resolution of all conflicts. The spheral indices aggregate and disaggregate the indices of traditional statistics on special digital technology that goes beyond the boundaries of our study. We do not touch upon these technical questions here, because they have been studied in detail in previous works [5; 6; 6a-d]. Spheral indices together with their digital statistical technologies of composition, decomposition, calculation, modeling and forecasting constitute an innovative digital global statistics (GLOBSTAT), suitable for all countries, industries, corporations, cities and other units of the world social production as a necessary tool for its digital economy and global peace. 4. Sources of Statistics on Employment and Unemployment of the Population in Russia
Because the classification of population according to SPHERONS is an unknown statistic, the number can be determined indirectly by available statistics.
In this study, we used three main sources of statistics on Russian employment and unemployment: •Data of Russia Population Census 2010 round (RPC-2010), published in 11 volumes [7; 8; 9; 10; 11]; •The Distribution of Employees of Enterprises and Organizations on Economic Activity Kinds on average for 2010. [2]; •Sample Data on the Number of Organizations’ Staff by the Activities Kinds and Staff Categories [2]. In 2010, the census enumerated the resident population of Russia. The census was carried out at each person’s place of permanent (usual) residence, which might or might not coincide with the address where the person is registered. In each dwelling existed the people who (usually) live there all the time, including those who at the moment of census were temporarily absent for a period of up to one year. The resident population is categorized by households: •private households; •collective households; •homeless households. The population living in private households, distributed by gender and age, were allocated as: •Children and adolescents aged 0–14 years; •The population aged 15–72 years; it is among the employed population in this age group that random observations about employment and professional composition of employees in the period after the census were conducted; •Persons aged 73 years and older. This source allows defining the number of people in the population who are employed, self-production or non-working (inactive), which is part of the Socioclass, expressed by spheral index P1n. 5. Classification by Branches of Economic Activity and Categories of Personnel
In this study were used three statistical classifications, according to:
1.Economic activity; 2.Industries/branches/types/kinds of economic activity (activities); 3.Personnel/staff categories. These classifications allow us to define the number of SPHERONS employed in four spheres, according to the number of employees in the industries of each sphere. Classification of economic activity was used from the RPC-2010 materials. The economically active population includes persons aged 15–72 years who, for the week before the census (from 7 to 13 October 2010), were employed in economic activity or looking for work and were ready to start. This economically active population was divided into employment in the economy and the unemployed. (Unemployed busy self-production are included in P1n of Socioclass/Spheron-1). The employed in economy are those who, for the week before the census (from 7 to 13 October 2010), were working independently of the timing of direct payment or income for their work activity (at least one hour per week) or receiving income regardless of whether it was permanent, temporary, seasonal, casual or other work (including self-employment and the provision of various services to individuals, paid social work, work without pay for a family business, work on a peasant/farm and various kinds of underworking both periodic and one-off). The employed were considered also the persons who performed household work on the production of goods or services, including agriculture, forestry, hunting, fishing and its processing, if the products are intended for market. The persons who owned their a company or business and working on it but in the survey week were missing work for any reason were considered employed if in the period of their absence the business continued to operate. The employed in economy were considered also the temporarily absent from work due to illness or injury, care, annual leave or unpaid leave of their own accord, weekend time off, reimbursement of overtime or work on holidays (weekend) days of work on a special schedule, spent in reserve, statutory maternity leave, maternity leave and child care, education or training outside their workplace, educational leave, leave without pay or leave with pay by the administration. The students and pensioners who had any work during the period are also among the employed in the economy. Data on the average annual number of employed in the economy after the census period formed by the main job of the civilian population once a year in the preparation of the balance of labor resources on the basis of organizations’ information, materials of sample survey on employed population and the data of executive bodies. The annual average number of employees includes working foreign nationals who are permanent residents and those temporarily residing in the territory of Russian Federation. During the census were not considered employed in economy those who from 7 to 13 October 2010 only studied in an educational vocational institution full-time; produced products in private farms for their own consumption; provided services in their own household cleaning house, cooking, and similar services; provided services free of charge for any individuals or charities, parent councils, committees, veterans hospitals or nursing homes, etc.; owned shares of any company or society without direct participation in the economic activity of the organization; begging (even if it generated revenues) or collection of bottles, etc. The unemployed are those who in the survey week did not have a job (gainful employment) and: - Were seeking work and were available for work during the survey week. Finding a job is considered a public or commercial employment service; so is use of or placing ads in the media, direct appeal to the administration of a company or potential employer, and use of personal connections to promote oneself, and the organization of one’s own business; - Found a job and proceeded to it two weeks after the survey week; - Found a job and expected a response from the administration or the employer with a response waiting period not to exceed one month. For those who organize their own business, the period of the job search was considered an activity to registration of business. Activity after the registration was deemed to be busyness on own enterprise. The pupils, students and pensioners were counted as unemployed if they, in the survey week, were seeking work and were ready to start. Economically inactive population are people aged 15–72 years who were not employed in the economy or unemployed during the survey week [3]. Classification of economic activity was used to highlight the following categories of the population aged 15–72 years: •Economically active population (employed and unemployed); •Economically inactive population (scholarship holders, pensioners, persons receiving benefits except unemployment benefits, engaged in private farming, etc.); •Persons who have not indicated economic activity. Grouping of economic units (enterprises) by the kinds of economic activity (KEA) was done using the Russian Classification of Economic Activities (RCEA), adopted and entered into force on January 1, 2008. RCEA is based on harmonization with the official version in Russian of Statistical Classification of Economic Activities in the European Community (NACE Rev. 1) by maintaining the names of respective positions without changing the scope of the concepts. These are the following types of activities [12]:
Table 2. Economic Activities
Section | Economic Activities | А | AGRICULTURE, HUNTING AND FORESTRY | B | FISHING | С | MINING AND QUARRYING | D | MANUFACTURING | E | ELECTRICITY, GAS AND WATER SUPPLY | F | CONSTRUCTION | G | WHOLESALE AND RETAIL TRADE; REPAIR OF MOTOR VEHICLES, MOTORCYCLES AND PERSONAL AND HOUSEHOLD GOODS | H | HOTELS AND RESTAURANTS | I | TRANSPORT, STORAGE AND COMMUNICATION | J | FINANCIAL INTERMEDIATION | K | REAL ESTATE, RENTING AND BUSINESS ACTIVITIES | L | PUBLIC ADMINISTRATION AND DEFENCE; COMPULSORY SOCIAL SECURITY | M | EDUCATION | N | HEALTH AND SOCIAL WORK | O | OTHER COMMUNITY, SOCIAL AND PERSONAL SERVICE ACTIVITIES | P | ACTIVITIES OF HOUSEHOLDS | Q | EXTRA-TERRITORIAL ORGANIZATIONS AND BODIES |
During the sample survey of payroll, the number of organizations by professional groups and economic activities conducted on October 31, 2012 is identified by the following categories of staff:
•Heads of organizations and their structural units (services); •Specialists of higher qualification; •Specialists of mid-level qualifications; •Employees engaged in the preparation of information, documentation, accounting and service; •Service workers, housing and communal services, trade and related activities; •Skilled workers in agriculture, forestry, hunting and fishery activities; •Skilled factory workers, construction, transport, communication, geology and exploration of mineral resources; •Operators, machinists of systems and machinery; •Unskilled workers. The above categories of staff were grouped into four groups to highlight four spheral classes or SPHERONS: The heads of organizations and their structural units (services) – P3, Orgclass; Specialists of higher and mid-level qualifications engaged learning and health care personnel – P1w, Socioclass; Specialists and employees involved in preparation of information, documentation and accounting – P2, Infoclass; Other categories of staff, except heads and employees involved in the preparation of information, documentation, accounting and service – P4, Technoclass.
In this case, the category of employees engaged in the preparation of information, documentation, accounting and service groups include the following personnel: •Stenographers and typists; •Operators using special equipment for the preparation and transmission of information (printer, telex, facsimile, cryptographic equipment and e-mail); •Operators of computers (PCs), employed various information input; •Operators of computers (counting machines, calculators, texture machine); •Secretaries and clerks; •Employees engaged in accounting transactions and accounting; •Employees engaged in the processing of statistical and financial information; •Employees engaged in the receipt and delivery of goods; •Employees engaged in dispatching production. •Employees engaged in accounting and on duty transport; •Employees engaged in card files and libraries; •Coders, proofreaders and related occupations; •Other employees engaged in the preparation of information, documentation and accounting; •Cashiers, including tickets cashiers; •Cashiers of banks and related occupations; •Employees to obtain payments on accounts, overdue and other cash amounts; •Employees engaged in receiving and informing visitors (receptionists, attendants of pass office, on the issuance of certificates and others); This group includes the specialists of scientific and design organizations, cultural institutions, art, media, advertising and the like. Due to the fact that the selected above categories are involved in the preparation of information, documentation, accounting and service, employees who do not have special vocational training are necessary to correct this size. Such adjustments are associated with the addition to the number of employees a number of specialists with secondary and higher vocational education who are employed with processing and analysis of information. Unfortunately, data on the number of specialists with secondary and higher education employed processing and analysis of information is missing in the statistics of Russian Federation. 6. Technique of Definition of Number of Russia SPHERONS Based on Statistics
The technique of determining the number of SPHERONS of employed (working, economically active) persons in Russia is a superposition and cumulative use of two traditional statistical classifications (KEA and categories of staff) on the structure of SPHERONS. Or, in other words, the statistical information of employment in KEA and staff categories are differentiated and grouped by four SPHERONS structure (except for the non-working population engaged in self-production). This technique can be expressed by the following table.
Table 3. KEA by Personnel Categories
Economic Activities (KEA) | Personnel Categories | P1w | P2 | P3 | P4 | Economic Activities, Table 2. | | | | |
Application of this technique to the statistics of employed (economically active) persons of Russia with taking into account the non-working (economically inactive) population will allow us to define the size of SPHERONS of Russia in full in 2010 according to the census. 7. Mid-year Population of the Russian Federation for 2010 Mid-year population of the Russian Federation for 2010 amounted to 142.938 million. This is calculated by the average chronological quarters of 2010. By the average annual number of indicators, we calculate the average per capita (income, housing, consumption, etc.). Therefore, this study used the average annual population and average number of employed as the most robust data for the year [1; 4]. 8. Definition of Number of Non-working Population (P1n) in Russia for 2010 The 2010 population census of the age and gender composition of the population living in private households identified the following age groups and calculated the structure of the non-working population employed in self-production [3; 7; 8; 9; 10; 11]:
Table 4. Employed self-production (non-working, economic inactive), millions
P1n | P1n = Employed self-production, sum of non-working, economic inactive: | 73,629 | 100% | | Age group 0–14 years: | 21,398 | 29,1 | | Age group 15–72 years, inactive: | 33,708 | 45,8 | | Age group 15–72 years, unemployed: | 6,647 | 9,0 | | Age group 15–72 years, the homeless: | 0,064 | 0,1 | | Age group 73 and older, inactive: | 9,979 | 13,6 | | Others: | 1,833 | 2,5 |
Calculated according to the RPC – 2010, Volume 7, Table 1, Population of private households by age groups, gender and economic activity [11]: http://www.gks.ru/free_doc/new_site/perepis2010/croc/perepis_itogi1612.htm
9. Number of SPHERONS in Russia for 2010 Table 5. Number of SPHERONS of Population in RUSSIA for 2010, in million people Spheral Indices | The Employed in Branches of Four Spheres | 2010 | % | P | All Population of Russia: P = P1+P2+P3+P4 | 142,938 | 100 | P1 | SOCIOCLASS, Spheron-1: P1 = P1w + P1n | 84,988 | 59,4 | P1w | P1w = sum of employed (working) in the branches of Sociosphere: | 11,359 | 7,9 | | M EDUCATION | 5,109 | 3,6 | | N HEALTH AND SOCIAL WORK | 4,203 | 2,9 | | O OTHER COMMUNITY, SOCIAL AND PERSONAL SERVICE ACTIVITIES | 2,046 | 1,4 | P1n | P1n = Employed of self-production, sum of non-working, economic inactive: | 73,629 | 51,5 | | Age group 0–14 years: | 21,398 | 15,0 | | Age group 15–72 years, inactive: | 33,708 | 23,6 | | Age group 15–72 years, unemployed: | 6,647 | 4,6 | | Age group 15–72 years, the homeless: | 0,064 | 0,0 | | Age group 73 and older, inactive: | 9,979 | 7,0 | | Others: | 1,833 | 1,3 | P2 | INFOCLASS, Spheron-2: = sum of employed in the branches of Infosphere: | 3,997 | 2,8 | | COMMUNICATION | 0,721 | 0,5 | | Science and scientific services | 0,755 | 0,5 | | Others | 2,521 | 1,8 | P3 | ORGCLASS, Spheron-3: = sum of employed in the branches of Orgsphere: | 10,775 | 7,5 | | L PUBLIC ADMINISTRATION AND DEFENCE; COMPULSORY SOCIAL SECURITY | 1,122 | 0,8 | | J FINANCIAL INTERMEDIATION | 3,905 | 2,7 | | Others: | 5,748 | 4,0 | P4 | TECHNOCLASS, Spheron-4: = sum of employed* in the branches of Technosphere**: | 40,930 | 28,6 | | А AGRICULTURE, HUNTING AND FORESTRY | 6,063 | 4,2 | | B FISHING | 0,130 | 0,1 | | С MINING AND QUARRYING | 0,930 | 0,7 | | D MANUFACTURING | 8,926 | 6,2 | | E ELECTRICITY, GAS AND WATER SUPPLY | 1,656 | 1,2 | | F CONSTRUCTION | 4,751 | 3,3 | | G WHOLESALE AND RETAIL TRADE; REPAIR OF MOTOR VEHICLES, MOTORCYCLES AND PERSONAL AND HOUSEHOLD GOODS | 9,882 | 6,9 | | H HOTELS AND RESTAURANTS | 1,011 | 0,7 | | I TRANSPORT AND STORAGE | 3,886 | 2,7 | | K REAL ESTATE, RENTING AND BUSINESS ACTIVITIES | 3,695 | 2,6 | | Statistical error | 2,248 | 1,6 |
Total in Table 5 are 32 indices + statistical error.
*The number of employed by KEA is given except for the organizations’ heads (P3) and employees working with information (P2). **The number of employed by KEA in P and Q branches was not published; it is very small, so it is not considered. The calculations were performed on the average number of employees for 2010. Note. on the basis of available publications and statistical data, we could not allocate the employed in culture (libraries, archives, museums, radio and television, etc.) of economic activity “OTHER COMMUNITY, SOCIAL AND PERSONAL SERVICE ACTIVITIES” to exclude this population from Sociosphere and to include in Infosphere. 10. Number of SPHERONS in Russia for 1991 and 1996
For comparison, we publish a similar table of SPHERONS of Russian population for 1991 and 1996, made in other state statistical classification of economic activities and published in 2002 [5, 71–72].
Table 6. Number of SPHERONS in Russia for 1991 and 1996 in million people Spheral Indices | The Employed in Branches of Four Spheres | 1991 | 1996 | 1996/% | P | All Population of Russia: P = P1+P2+P3+P4 | 148,5 | 148 | 100 | P1 | SOCIOCLASS:P1 = P1w + P1n | 81,6 | 89,1 | 60,2 | P1w | P1w = sum of employed (working) in the branches of Sociosphere: | 6,8 | 7,1 | 4,8 | | Education | 2,5 | 2,5 | 1,7 | | Health, social welfare, sports | 4,3 | 4,6 | 3,1 | | Priests | - | - | - | P1n | P1n = Employed of self-production, sum of non-working, economic inactive: | 74,8 | 82,0 | 55,4 | | Pensioners, invalids | 33,8 | 37,1 | 25,1 | | Pupils, students (full time) | 25,5 | 26,6 | 18,0 | | Preschoolers and housewives | 11,8 | 11,5 | 7,8 | | Unemployed | 3,6 | 6,8 | 4,6 | P2 | INFOCLASS = sum of employed in the branches of Infosphere: | 8,5 | 7,4 | 5,0 | | Science and scientific service | 0,9 | 0,9 | 0,6 | | Communication | 2,8 | 1,6 | 1,1 | | Culture and art | 4,8 | 4,9 | 3,3 | P3 | ORGCLASS = sum of employed in the branches of Orgsphere: | 4,0 | 4,6 | 3,1 | | Number of the management staff | 1,7 | 1,9 | 1,3 | | Finance, credit, insurance | 0,4 | 0,9 | 0,6 | | Other branches (defense, policy, security, custom-house etc.) | 1,9 | 1,8 | 1,2 | P4 | TECHNOCLASS = sum of employed in the branches of Technosphere: | 54,4 | 46,9 | 31,7 | | Industry | 22,4 | 16,3 | 11,0 | | Agriculture and wood industry | 9,8 | 9,8 | 6,6 | | Construction | 8,5 | 6,3 | 4,3 | | Transport | 4,9 | 4,4 | 3,0 | | Trade and public nutrition | 5,6 | 6,8 | 4,6 | | Housing and communal services | 3,2 | 3,3 | 2,2 |
11. Conclusion: Problems and Significance of the Study
The problems of this statistical study are caused by its novelty (nobody has conducted similar studies) and its colossal labor input. These problems become apparent when expanding the content of research, for example, as proposed in its Program [6a], including an analysis of the economic situation of SPHERONS, their income, their participation in government, their education and, similarly, their qualities in dynamics for years, in different countries and at different levels from municipal to global, starting from schools, hospitals, small businesses and settlements to large corporations, cities and countries.
The significance of this study is difficult to overestimate. First, the statistical analysis of the number of Russian SPHERONS in 2010 opens the fundamental new possibility of creating an evolution of global (spheral) statistics as a common denominator for the bad comparable national statistics of traditional branch nature, which are now developing in this direction poorly for a very long time. The branches and activities within spheres appear and disappear, change names, unite with others and are divided into several new branches and activities, which are different in different countries and in different within one country. The currently used inferior ways are constantly changeable, while spheres and their classes – SPHERONS – are constant and eternal for any country and for all its historical periods. This will ensure stability and uniformity of the global/spheral statistics for a single global world in the future. Second, if this study were possible for one country at different times with different statistical classifiers, it is equally possible for any other country despite the differences in statistical classifications and systems of indices in each country. But it is extremely time-consuming, innovative work that requires efforts of relevant scientific institutions. Now statistical studies of spherons are conducted in other countries, for example, in Ghana, India and Pakistan. Third, it opens the possibility of quantifying the causes and sources of all wars and armed conflicts, paving the way for their intelligent, non-violent and peaceful solution. Global/spheral statistics is an essential element of global peace science (GPS), without which it cannot exist and the necessary technological tool for its implementation in the process of conscious building global peace. In place of baseless and eternal accusations by warring parties, the SPHERONS method is able to put accurate, statistical assessment of the scale of mutual contradictions and disharmony and indicate ways to eliminate or minimize them for beneficial mutual interests and nonviolent way. Fourth, development of other social sciences depends from the global/spheral statistics of SPHERONS; for example, forecasting, without which “the future loses certainty” and humanity is deprived of scientific wisdom. Academicians Viktor Sadovnichiy and Daisaku Ikeda present this idea. In particular, they wrote: “Today, the mathematical theory of forecasting (which is inseparable from statistics – L.S.) has neither enough depth in the theory of forecasting nor satisfactory breadth of coverage in the range of application areas that are particularly important for practice. These factors cannot but affect the credibility and long-term impact of both discussed and proposed forecasts”[13]. Now “Global Peace Science” (GPS) from the spherons structural harmony crystallizes in its social genome a “deep theory of forecasting.”[6]. This science ensures the reliability, durability and worldwide breadth of forecasting, but require the development of new mathematics of harmony and global statistics suitable for the expression and calculation of spheral indices for the spherons’ structural harmony. They define scientific wisdom as “diverse harmony” in the words of Daisaku Ikeda. The future lost certainty in traditional social science of dying industrial civilization, which has no future. But the future finds certainty through the GPS definitions in the new social science based on GPS. This future is a harmonious civilization of SPHERONS, conscious/scientific global peace without wars, conservation of nature, gender, economic and political equality, justice and love. Fifth, this first statistical proof and the study of Russian spherons has great scientific, political, economic and peacemaking significance for the country. But it requires expansion both in time and in depth, in the subjects of the Russian Federation and in large cities, which will create spheral macro statistical map of its state and development with all its positive and negative trends, including trends in the growth of social tensions between the spherons in different regions and at different stages. This knowledge will allow the country's leadership to find harmonious ways to overcome these disharmonies and ensure a stable peace from the structural genetics of national spherons. But this requires a lot of innovative scientific and practical work in the future, which is just beginning and which will undoubtedly reach the level of conscious building global peace from its structural genetics. References 1.Regions of Russia. Socio-economic Indicators 2013. Statistical Collection. M: 2013 2.Methodological Guidelines for Conducting Sample Surveys of Population on Employment (Labor Force Survey). M: 2010: http://www.gks.ru/free_doc/new_site/population/trud/Untitled452-10.pdf 3.Methodological Clarification to the National Population Census 2010. M: 2010 4.Statistical Yearbook of Russia 2013. –M: 2014 - Semashko, Leo (2002) Tetrasociology: Responses to Challenges. –St Petersburg: http://peacefromharmony.org/?cat=en_c&key=145
6.Semashko, Leo and GHA 75 coauthors (2012). The ABC of Harmony for World Peace, Harmonious Civilization and Tetranet Thinking. New Delhi, Doosra Mat Prakashan. http://peacefromharmony.org/?cat=en_c&key=478 6a. Semashko Leo and 173 coauthors from 34 countries. Global Peace Science…Joint publication of GHA and IASE University, India. World textbook. The first publication in English, Smaran Publication, New Delhi. 2016. 616 p. ISBN 978-81-929087-8-6: http://peacefromharmony.org/docs/global-peace-science-2016.pdf 6b. Semashko, Leo (2018) The ABC/Paradigm of Tetranet Thinking for "New Women" harmonious feminism: http://peacefromharmony.org/?cat=en_c&key=824 6c. Kashina, Olga, Semashko Leo (2014). Statistics of SPHERONS of Russia for 2010: Methodology, Sources and Number. (In the book: 6a) and here: http://peacefromharmony.org/?cat=en_c&key=593 6d. Kashina, Olga (2006) Demography and population statistics / Ed. I.I. Elisseeva.-M: Finance and Statistics, Ch. 13 6e. Maturana, Humberto & Varela, Francisco ([1st edition 1973] 1980). Autopoiesis and Cognition: the Realization of the Living. 6f. Paetau, Michael. Niklas Luhmann and Cybernetics. Journal of Sociocybernetics. Vol 11 No 1/2 (2013): https://papiro.unizar.es/ojs/index.php/rc51-jos/article/view/790 6g. Afanasyeva, Vera; Avery, John; Ecimovic, Timi and Semashko, Leo (2017) Thermodynamics and Negentropy of Spheral Classes Societal Harmony: Global Peace Thermodynamics: http://peacefromharmony.org/?cat=en_c&key=756 7.Russian Census of Population 2010 (RCP-2010): 8.RCP-2010: Volume 1 Number and Distribution of the Population 9.RCP-2010: Volume 2 Age and Sex Composition and Marital Status 10.RCP-2010: Volume 6 The Size and Composition of Households 11.RCP-2010: Volume 7 The economic Active and Inactive Population 12.The National Classifier of Economic Activities OK 029-2007 (NACE Rev. 1.1). –M.: 2012 13.Sadovnichiy, Victor and Ikeda, Daisaku (2013). At the Turn of the Century. Dialogue on the Essentials – Moscow: Moscow University Press Olga Kashina, Ph.D. (Statistics), Professor, State Educational University, Graduated the Leningrad Finance and Economics Institute in 1976, specialty “Statistics.” In 1982 doctoral thesis of economic sciences on statistics. Teaching statistics in universities since 1977. Published more than 70 scientific works, including co-authorship of three textbooks for high schools on statistics. Expert of Rosstat in St. Petersburg and Leningrad region (Petrostat). Address: St. Petersburg, Russia; Webpage: http://peacefromharmony.org/?cat=ru_c&key=757 E-mail: olgkash2007@rambler.ru Leo M. Semashko, Ph.D. (Philosophy), Education: Moscow State University, Philosophical Faculty, “History of Foreign Philosophy” Chair; RANH Professor; Founding President, Global Harmony Association (GHA) since 2005; GHA Honorary President since 2016; State Councilor of St. Petersburg; Philosopher, Sociologist and Peacemaker from Harmony; Author of more than 600 scientific publications, including 18 books in 1-12 languages; Author of Tetrism/Harmonism as the unity of Tetraphilosophy and Tetrasociology as third order Sociocybernetics – science of social harmony, global peace and harmonious civilization; Director: Tetrasociology Public Institute, Russia; Honorary Member of the RC51, Sociocybernetics, International Sociological Association; Director, GHA Web portal “Peace from Harmony”: http://peacefromharmony.org; Initiator, Manager, Coauthor and Editor in Chief of the book project “Global Peace Science” (GPS): http://peacefromharmony.org/docs/global-peace-science-2016.pdf. Address: St-Petersburg, Russia; Phone: +7(812)-597-6571; E-mail: leo.semashko@gmail.com Personal page: http://peacefromharmony.org/?cat=en_c&key=253 28-07-18
--------------------------------------------------------------------------------------------
Global Peace Science: Structural Harmony of Spherons and Statistics of Ghana’s Spherons for 2010, 2000 and 1984 By Stephen Amoah and Ayo Ayoola-Amale AbstractThis study is the application ofthe Spherons (spheral macro classes) theory of tetrasociology to analyze the 2010, 2000 and 1984 Ghana population and housing census statistics of the country taking into consideration the population spheral classes to provide insights on macro employment in the country. Specifically, the study investigated the population macro structure in terms of its spheral classes using spheral indices to express the spherons. The purpose of our statistical study was to define the macro distribution of Ghana’s population based on its spheral classes and their dynamics in 2010, 2000 and 1984. The analysis showed a disharmonious distribution favoring the socioclass and technoclass within the overall spheral classes’ picture in comparison with the orgclass and infoclass. Of the two macro groups in the socioclass, the non-working population far outstripped the working population. An in-depth study of the dynamics of the spheral classes of a country, allows revealing profound social contradictions that can lead to the armed conflicts. Conscious regulation therefore ensures their prevention and lead to peaceful life of the population. The questions of statistics of spherons, their dynamics and indices are new for the social sciences and at the same time very important for them, especially for the economy and for ensuring peace at all levels. Keywords: Spherons, tetrasociology/sociocybernetics, spheral indices, autopoiesis, spheral classes Contents IntroductionThe global search for development and peace among nations has led to the proposal of various strategies with the ultimate goal of achieving harmonious stability of humanity and every society. The Spherons discovery and the statistical study of them identified by the tetrasociology/sociocybernetic conception [11; 12; 12a; 14 etc.], which places the right emphasis on human security and peace, holistically, covers the entire society with all its resources: people, information, organisation and things including environment. This understanding of human security and peace, as against the traditional concept of protection of national borders and investment in military readiness [13], is the emerging model for resolution of the conflicts that have evolved over the centuries. The line of reasoning of the Spheron’s theory is, if humanity align itself to the tetrasociology /sociocybernetic concept, humanity stands the chance to experience the peace from harmony that has eluded it earlier. The Spherons theory promises to bring the ultimate goal of harmonious and peaceful development of humanity and every society as it focuses on people and provides the real macro picture of the distribution of people on the Spherons and social resources between them. This ensures the achievement of structural harmony in the effective decision making all partial conflicts. The study of the Spherons of Russia [12] has brought out issues for the right scientific understanding of global and national peace. In our study of Ghana’s Spherons, we seek to apply similar approach to the dynamics of Ghana’s population through its macro spheral classes and vis-à-vis the labour market. Objective of studyTo study the demographic structure of the population of Ghana in terms of its spherons or spheral classes and its dynamics in a first approximation in the three time points. Data and MethodologyThe main data sources for this study are the 1984, 2000 and 2010 Population Census of Ghana (PCG) [1] [2] [3] with emphasis on the 2010 census. The study involved desktop review and analysis of the census documents by applying the Spherons methodology and spheral indices to express the statistics. Data LimitationsThe period of conducting a census is of great importance in the census undertaking. The 2010 census was conducted in the months of September and October. All the other censuses in the post-independence era were carried out in the month of March. This is worthy of note because it might also affect the classifications of the economically active population as well as the type of activity in which they are engaged given seasonal differences in employment opportunities. The categories of occupation and industry in the 1960, 1970, 1984 and 2000 censuses were different from those in the 2010 census given recent revisions and the introduction of new categories. In the 2010 census for example, occupation categories such as “elementary occupation” and “craft and related trade workers” were introduced. Similarly, industry groups such as “accommodation and food service activities” and “information and communication” were introduced to reflect changes in the economy. For this reason, there are differences in the employment categories and industrial sectors between the 2010 census and the previous ones. Definitions SPHERONS. “Spherons” or “spheral classes of the population” can be defined as the extremely large groups of people covering population in a whole and employed in four spheres or spheral categories/sectors of social production. These spherons produce in these spheres the appropriate extremely large groups/categories of social resources/products:People, Information, Organisation and Things (PIOT) and therefore they differ on the main (on time) employment in one of the spheres with one of these resources/products[11; 12; 12a]. SPHERES OF PRODUCTION. The Spherons’ theory distinguishes four spheres of production, which are defined as: 1. Social sphere or Sociosphere (S): The subject and product of which are people (P); 2. Information sphere or Infosphere (I): The subject and product of which is information (I); 3. Organization sphere or Orgsphere (O): This sphere has organisation (O), management, politics, law, finance, defense etc. as its subject and product; 4. Technical (economic/environmental) sphere or Technoecosphere (T): The subject and product of this sphere are the things including all material goods and services (T). All four spheres together are referred as “SIOT”, in which are employed four Spherons “SIOT-classes”, who produce in them the “PIOT” spheral resources/products. The “PIOT” spheral resources/productsare expressed by the special “spheral indices”. The first from them are the spheral indices of the Spherons [11; 12; 12a]. The Spherons spheral indices are the main subject ofstatistical research here and in all similar studies. EMPLOYMENT TWO CLUSTERS. Employment/occupation, in its multidimensional topology has two principal clusters: (1) Self production or ‘autopoiesis’ [9] and (2) Labor or economic employment of people by other resources except own “I” or “Myself”. 1. Self-production or ‘autopoiesis’ is explained as employment of each person by himself from birth to death.in processes such as eating, sleeping, learning, communication, recreation etc. Autopoiesis belongs only to Sociosphere because it includes all kinds of human activity except economic/labor activity. The term was introduced by Umberto Maturana and Francisco Varela (1973) [9] for theoretical biology to describe the self-reproduction of living cells. Niklas Luhmann in 1990 [8] reinterpreted the term in sociology to describe characteristics of human communication as the key element of social system. 2. Labor or economic employment of people by other resources except “I”. This is formally established within norms of labor activity of society. The labor activity is a part of self-production known as “seniority (work experience)” or “experience of labor activity”. It is part of each person’s life. The two clusters of employment divide the entire population into two parts: (1)Nonworking (economically inactive) population employed in Sociosphere by self-production (2)Working or economically active population employed in all spheres. The Spheral indices of the Spherons
The spheral indices, which are used to express the SPHERONS, are defined as follows:
Table 1. Spheral indices of Spherons P | Population/people in general for any level and community from family, school and town up to country and the world. | P1 | Socioclass, Spheron-1, who are employed in the branches of sociosphere (first sphere); | P1n | Non-working population, who are employed in self-production (‘autopoiesis”, Maturana [10])of sociosphere and forming the Spheron-1first part; | P1w | Working population in the branches of Sociosphere and who constitute the Spheron-1 second part. Therefore, P1 = P1n + P1w; | P2 | Infoclass, Spheron-2, who are employed in branches of Infosphere (second sphere); | P3 | Orgclass, Spheron-3, who are employed in branches of Orgsphere (third sphere); | P4 | Technoclass, Spheron-4, who are employed in branches of Technosphere (economic, fourth sphere). |
Each spheral class is a separate SPHERON covering part of the population employed in one of the four spheres of social production. In sum, the number of people of the four SPHERONS is the total population. This is expressed by the formula: P =P1 (P1n + P1w) + P2 + P3 + P4 or Population/People= Spheron-1 (nonworking + working) + Spheron-2 + Spheron-3 + Spheron-4. This is the fundamental formula of the population/people of any community from the family, town, and country to humanity as a whole in the Spherons spheral indices. The principal advantage and excellence of the spheral indicators is that they ensure the global digitalization of all national statistical indices, constitute their common denominator, logically organize/systematize/integrate them and open the way for the digital economy, for digital global peace through digital/conscious prevention of all wars and nonviolent resolution of all conflicts. The spheral indices aggregate the indices of traditional statistics on special technology that goes beyond the boundaries of our study. These questions are not discussed here, because they have been studied in detail in previous works [11; 12; 12a]. Employment and Unemployment Statistics, Ghana 2010 PHC Ghana’s population at 2010 was 24,658,823 with a total of 5,467,136 households of which more than half (55.8%) are in urban areas. The average household size was 4.4. The Census covered three different population groups: (1) household population; (2) non-household (Group Quarters/institutional) population; and (3) Out-door sleepers/floating population. Majority of household heads (76.6%) were economically active (GSS, 2012) [3; 4; 5]. Ghana’s population has a youthful structure with a broad base consisting of large numbers of children and a conical top of a small number of elderly persons. The 2010 Census indicated the population under 15 years constituted 38.5%. Population 15-24 years constituted 20.0%, population 25-59, constituted 35% and population 60+ years, 6.7 percent. The three most common occupations that household heads engaged in were: agriculture, forestry and fishery; services and sales; and craft and related trades. Agriculture is more popular in rural localities for both male and the female household heads. The service and sales sector is more popular among urban household heads. Most household heads are self-employed in the private informal sector of the economy, with a minority in the private formal and public sectors as employees. The statistics on employment and unemployment on Ghana’s population was mainly obtained from the 2010 population and housing census conducted by the country. Definition of employment and unemployment was based on ILO regulations on labor statistics. The age for employment used in the Census was 15-65 years. The 2010 PHC defined employed population as comprising of the following: •The population that worked •The population that did not work but had job to go back. •The population that did voluntary work without pay. The unemployed population was defined as comprising of: •The population that worked before seeking work and available for work. •The population seeking work for the first time and available for work [3; 4; 5]. Table 2. Employed and unemployed population by sex, 2010 PHC Status | Population | Male | Female | Employment | 10,939,923 | 5,372,379 | 5,567,544 | Unemployment* | 579,743 | 256,825 | 323,918 | *The unemployed population was defined as persons 15+ years who had no fixed job, not seeking for job and not available for work. |
Classification by branches of economic activity and categories of personnel.
Definitions and Concepts. Economic Activity The question on economic activity was asked of all persons five years and above who engaged in any activity for pay (cash or kind) or profit or family gain for at least one hour during the seven days preceding census night. Economically active population The economically active population was defined as persons who: ·Worked for pay or profit or family gain for at least one hour within the seven days preceding census night. This category of persons included those who were in paid employment or self-employment or contributing family workers; ·Did not work, but had job to return to; ·Were unemployed and actively looking for work. Economically not active population The economically not active persons were those who did not work and were not seeking for work. The category included homemakers, full time students, retired persons, the disabled and persons who were unable to work because of their age or ill-health. Labour force The labour force comprised employed persons who had jobs or businesses and the unemployed. The term economically active population by the census definition was the same as the labour force. Therefore, these terms are used interchangeably in the chapter as appropriate. Workforce (the employed) Workforce represents the total number of workers actively employed, or available for work. It consisted of all persons aged 15 years and above, who during the reference period, were in the following categories: ·At work, that is, persons who during the reference period performed some work for wage or salary either in cash or in kind or worked without pay. ·Had a job to go back to, but did not work within the reference period. The Unemployed This comprises all persons aged 15 years and above, who during the reference period were: ·Without work and had no fixed jobs; ·Currently available for work; ·Seeking for work by taking specific steps to look for work (e.g. writing applications, visiting job sites, visiting employment agencies and seeking help from friends and relatives in the search for jobs Classification of economic activities
The classification of economic activities in the 2010 PHC was done using the International standard classification of All Economic Activities (ISIC) revision 4 [8]. The ISIC rev 4 is the international reference classification of productive activities. Its main purpose is to provide a set of activity categories that can be utilized for the collection and reporting of statistics according to such activities.
Table 3: Economic Activities
SECTION | DESCRIPTION OF ECONOMIC ACTIVITY | A | Agriculture, forestry and fishing | B | Mining and quarrying | C | Manufacturing | D | Electricity, gas, stream and air conditioning supply | E | Water supply, sewerage, waste management and remediation activities | F | Construction | G | Wholesale and retail, repair of motor vehicles and motorcycles | H | Transportation and storage | I | Accommodation and food service activities | J | Information and communication | K | Financial and insurance activities | L | Real estate activities | M | Professional, scientific and technical activities | N | Administrative and support service activities | O | Public administration and defense, compulsory social security | P | Education | Q | Human health and social work activities | R | Arts, entertainment and recreation | S | Other service activities | T | Activities of households as employers, undifferentiated goods –and services – producing activities of households for own use | U | Activities of extraterritorial organizations and bodies |
The 2010 PHC used the International Standard Classification of Occupation (ISCO-08) as the basis for the national occupation classification. The ISCO-08 divides occupations into 10 major groups with each major group further organized into sub-major, minor and unit groups. The skill level and specialization required to competently perform the duties of the occupation are the basic criteria use to define the system. The major groups are as follows: Table 4.National Occupation Classification 0 | Armed forces occupations | Commissioned armed forces officers, non-commissioned armed forces officers and armed forces occupations, other ranks. | 1 | Managers | Chief executives, senior officials and legislators. Administrators and commercial managers, production and specialized services managers. Hospitality, retail and other services managers | 2 | Professional | Science and engineering professionals, health professionals, teaching professions, business and administration professionals, information and communication technology professionals, legal, social and cultural professionals | 3 | Technicians and associate professions | Science and engineering associateprofessionals, health associate professionals, Business and administration professionals, legal social, cultura and related associate professionals, Information and communication technicians | 4 | Clerical support workers | General and keyboard clerks, Customer services clerks, Numerical and material recording clerks, other clerical support workers | 5 | Service and sales workers | Personal service workers, sales workers, persona care workers, protective services workers | 6 | Skilled agricultural, forestry and fishery workers | Market-oriented skilled forestry, fishery and hunting workers, subsistence farmers, fishers, hunters and gatherers | 7 | Craft and related trades workers | Building and related trades workers, excluding electricians, metal, machinery and related trades workers, handicraft and printing workers, electrical and electronic trades workers, food processing, wood working garment and other craft and related trades workers | 8 | Plant and machine operators, and assemblers | Stationary plant and machine operators, assemblers, drivers and mobile plant operators | 9 | Elementary occupations | Cleaners and helpers, agricultural, forestry and fishery laborers, laborers in mining, construction, manufacturing and transport, food preparation assistants, street and related sales and service workers, refuse workers and other elementary workers | Source: International Standard Classification of Occupation (ISCO-08) |
The above categories of staff were grouped into the four spheral classes. (1)Heads of organization and their structural units (services) constituted the Orgclass (P3) (2)Specialists, and those with higher and mid-level qualificationsand engaged learning and health care personnel constitute the Socioclass (P1w) (3)Specialists and employees involved in the preparation of information, documentation and accounting make up the Infoclass (P2). (4)Other categories of staff, except heads and employees involved in the preparation of information, documentation, accounting and service constitute the Technoclass (P4) Determining the number Spherons based on Statistics In determining the number of spherons of the employed, the statistical information of both the employed (economically active population) and the unemployed (economically inactive) from the 2010 PHC was applied as follows. ResultsTable 5. Personnel Categories Economic Activity | | Personnel Categories | | | P1w | P2 | P3 | P4 | Economic Activities – Table 3 | 1,011,670 | 139,823 | 230,184 | 8,866,310 | | | | | | |
The mid-year population of Ghana for 2010
The mid –year population of Ghana (24,512,104) was computed using the component method. The estimate used the census definition of people who are “usually resident” in Ghana (Those present at the census night). The estimates roll forward the population found by the previous census (2000), one year at a time by accounting for births and deaths. Net migration was assumed to be zero.
Number of non-working population (P1n) in Ghana, 2010
The economically not active persons were those who did not work and were not seeking for work. The category included homemakers, full time students, retired persons, the disabled and persons who were unable to work because of their age or ill-health. Table 6. Employed self-production (non-working, economic inactive).
P1n | P1n = Employed self-production, sum of non-working, economic inactive | 14,410,836 | 100 % | | Did home duties (household chores/full time homeworker) | 1,308,455 | 9.1 | | In full time education / student | 6,480,996 | 45.0 | | Pensioner / Retired | 143,105 | 1.0 | | Disabled / Too sick to work | 222,649 | 1.5 | | Too old / Too young | 5,873,446 | 40.8 | | Other | 382,185 | 2.7 |
Extracted from Ghana 2010 PHC Report (www.statsghana.gov.gh) SPHERONS in Ghana, 2010 Table 7. Number of SPHERONS of Population in Ghana for 2010 Spheral Indices | The employed in branches of Four Spheres | 2010 | % | P | All population of Ghana: P= P1+P2+P3+P4 | 24,658,823 | 100 | P1 | SOCIOCLASS, Spheron-1: P1= P1w + P1n | 15,422,506 | 62.5 | P1w | P1w = Sum of employed (working) in the branches of Sociosphere | 1,011,670 | 4.1 | | P EDUCATION | 409,694 | 1.7 | | Q HEALTH AND SOCIAL WORK | 125,254 | 0.5 | | S OTHER COMMUNITY,SOCIAL& PERSONALSERVICE ACTIVITIES | 476,722 | 1.9 | P1n | P1n = Employed of Self-Production , sum of nonworking | 14,410,836 | 58.0 | | Did home duties (household chores/full time homeworker) | 1,308,455 | 5.3 | | In full time education / student | 6,480,996 | 26.3 | | Pensioner / Retired | 143,105 | 0.6 | | Disabled/Too sick to work | 222,649 | 0.9 | | Too old / Too young | 5,873,446 | 23.8 | | Other | 382,185 | 1.5 | P2 | INFOCLASS, Spheron-2: = Sum of employed in the branches of Infosphere: | 139,823 | 0.6 | | COMMUNICATION | 43,600 | 0.2 | | Science and Scientific Services | 96,223 | 0.4 | P3 | ORCLASS, Spheron-3: = Sum of employed in the branches of Orgsphere: | 230,184 | 0.9 | | O Public Administration & Defense | 154,559 | 0.6 | | K Financial Intermediation | 72,666 | 0.3 | | U Activities of extra territorial organization | 2,959 | 0.0 | P4 | TECHNOCLASS, Spheron-4: = Sum of employed in the branches of Technosphere: | 8,866,310 | 36.0 | | A Agriculture, Forestry & Fishing | 4345,723 | 17.6 | | B Mining & Quarrying | 115,394 | 0.5 | | C Manufacturing | 1,135,612 | 4.6 | | D Electricity & Gas | 16,237 | 0.1 | | F Construction | 321,360 | 1.3 | | G Wholesale & Retail Trade | 1,981,290 | 8.0 | | I Accommodation & Food | 574,671 | 2.3 | | H Transport & Storage | 371,461 | 1.5 | | L Real Estate | 4,562 | 0.0 |
Source: Ghana 2010 PHC Report SPHERONS in Ghana, 1984 and 2000
Table 8. SPHERONS of Ghana’s population for the 1984 and 2000.
Spheral Indices | The Employed in Branches of Four Spheres | 1984 | 2000 | 2000/% | P | All Population of Ghana: P = P1+P2+P3+P4 | 12,296,081 | 18,912,079 | 100 | P1 | SOCIOCLASS, Spheron-1: P1= P1w + P1n | 9,653,493 | 13,566,411 | 71.7 | P1w | P1w = sum of employed (working) in the branches of Sociosphere: | 2,428,112 | 2,330,907 | 12.3 | | P EDUCATION | 1,287,885 | 2,007,043 | 10.6 | | Q HEALTH AND SOCIAL WORK | 787,885 | 174,140 | 0.9 | | S OTHER COMMUNITY,SOCIAL& PERSONALSERVICE ACTIVITIES | 352,342 | 149,724 | 0.0 | P1n | P1n = Employed of self-production, sum of non-working, economic inactive: | 7,225,381 | 11,235,504 | 59.4 | | Homemakers | 1,702,231 | 4,941,182 | 26.1 | | student | 3,631,108 | 4,436,230 | 23.5 | | Vocational Trainees | 10,987 | 647,629 | 3.4 | | Income Recipients | 17,919 | 62,379 | 0.3 | | Old age | 1,287,885 | 333,050 | 1.8 | | Retired / Pensioner | 287,885 | 145,807 | 0.8 | | Persons with disability | 159,712 | 94,401 | 0.5 | | others | 415,539 | 574,826 | 3.0 | P2 | INFOCLASS, Spheron-2: = sum of employed in the branches of Infosphere: | 796,375 | 2,223,541 | 11.8 | | COMMUNICATION | 8,490 | 1,737,541 | 9.2 | | Science and Scientific Services | 787,885 | 486,000 | 2.6 | P3 | ORCLASS, Spheron-3: = sum of employed in the branches of Orgsphere: | 121,292 | 150,150 | 0.8 | | O Public Administration & Defence | 97,548 | 105,764 | 0.6 | | K Financial Intermediation | 21,915 | 40,386 | 0.2 | | U Activities of extra territorial organization | 1,829 | 4,000 | 0.0 | P4 | TECHNOCLASS, Spheron-4: = sum of employed in the branches of Technosphere: | 1,724,921 | 2,971,977 | 15.7 | | A Agriculture, Forestry & Fishing | 117,529 | 302,505 | 1.6 | | B Mining & Quarrying | 26,828 | 103,662 | 0.5 | | C Manufacturing | 588,418 | 788,068 | 4.2 | | D Electricity & Gas | 15,437 | 26,409 | 0.0 | | F Construction | 64,686 | 232,611 | 1.2 | | G Wholesale & Retail Trade | 774,157 | 1,119,395 | 5.9 | | I Accommodation & Food | 17,990 | 169,274 | 0.9 | | H Transport & Storage | 114,316 | 217,485 | 1.1 | | L Real Estate | 5,560 | 12,568 | 0.0 |
Conclusion and Discussion
Generally, the larger the employed population, the more wealth is created leading to the general well-being of the population. In Ghana, over the years, a number of job opportunities have been created in the public and private sectors in a wide range of economic activities. Contributing to employment opportunities in any country or area are factors such as the structure of the population, proportion of the economically active population and the labour market.
Our research of the Ghana’s spherons identified the four production spherons of Ghana and the employment status of its citizens in each spheral class. The study shows that, at 2010, the population size of Ghana’s Socioclass (Spheron-1, P1) constituted the highest proportion (62.5%) of the employed in all four spheres. This was followed by the Technoclass (Spheron-4, P4) employing 36.0%, the Orgclass (Spheron-3, P3) with 0.9% and the Infoclass (Spheron-2, P2) with 0.6% in that order. Table 6 shows the employed by self-production, "autopoiesis", in accordance with the theory of Maturana [9] and its sociological interpretation of Luhmann [8]. This is a non-working, economically inactive group, but it is very important socially, preparing a human resource for economic activity or providing its exit from it by age or health.The highest proportion in this group is made up of full time persons in education / students (45.0%), followed by persons considered as too old or too young (40.8%) and those who did home duties household chores/full time homeworker (9.1%). The disabled/too sick to work, pensioners/retired and other constituted 1.5%, 1.0% and 2.7% % respectively. Table 7 shows the distribution and size of the spherons as determined by the employed statistics of the 2010 PHC and the spheral indices. Overall, the employed population (P) in Ghana at 2010 was 24,658,823. The Socioclass (P1), made up of working (P1w) and non-working (P1n) employed the highest number of people (62.5%). This figure is made up of 4.1 % (P1w) economically active (working) population and 58.0 % (P1n) economically in-active or non-working population. This situation signifies a very unhealthy situation for the country. The table further shows the infoclass (P2) employed 0.6%, the Orgclass (P3) employed 0.9% and the Technoclass (P4) 36.0%. Table 8 also shows the distribution of Spherons in Ghana in 1984 and 2000. The table shows that in 2000 about 7 in 10 persons (71.7%) of the employed population were in the Socioclass (P1). Over the period (1984 to 2000), this Spheron (P1) employed the largest proportion of the population growing from 9,653,493 in 1984 to 13,566,411 in 2000, an increase of about 40 % in a period of 16 years. The non-working population (P1n) also increased from 7,225,381 to 11,235,504 within the period unlike the working in this sphere population (P1w), which dropped from 2,428,112 to 2,330,907. The overall increase in the socioclass (P1), however, favoured (P1n), the non-working class which increased by 56% while the working class (P1w), dropped by 4 % within the period. Table 8 again shows the Infoclass (P2) recorded an increase in numbers over the period 1984 to 2000 almost three times (796,375 to 2,223,541). At 2000 the Infoclass t constituted 11.8 % of the all employed population. The Orgclass (P3) also recorded an increase in numbers from 121,292 in 1984 to 150,150 in 2000. At 2000 this Spheron constituted 0.8 % of the employed population. The Technoclass (P4), recorded an increase in numbers within the period and formed 15.7% of the population in 2000. This is the second highest after the Socioclass Spheron. In sum, there is a steady increase in the population of Ghana, mainly due to the growth of the socioclass/spheron-1. In it, the increase in the number of non-working population (P1n) in comparison with the working population (P1w) in this and other spheres has been worrying for many years. This situation puts pressure on the working population, increasing, on the one hand, the workload on it, and on the other hand, reducing the opportunities of well-being for the non-working. Disproportions and disharmony in the dynamics of the Spherons’ number exacerbate the whole spectrum of social risks from economic and political to environmental and demographic. With the exception of an increase in employment in the technoclass (36.0%) for 2010 compared to 15.7% in 2000, there were declines in employment in the three other spherons (Infoclass, Orgclass and Socioclass) for 2010 compared to 2000. The growth in the number of technoclass in 2010 loses growth in employment in other spheres in 2010. This is a clear case of the spheral disharmony in the holistic structural system of Ghanaian spherons. This problem deserves the most intensive scientific research and close attention of the country's leadership. An in-depth research of Ghana’s spherons will provide fundamental information that is necessary to achieve an optimal balance in the structural harmony of Ghanaian spherons and spheres of social production. Achieving spheral balance and harmony will ensure the creation and harmonization of the necessary strategies for overcoming poverty, corruption and inequality. This will bring lasting peace and prosperity to the country. Of course, we understand that our first statistical research of Ghana’s spherons is only the first swallow and the initial step on the long journey of innovative statistical digital studies of Ghana's social production as a whole. only its holistic spheral research using spheral statistics and its universal digital technology (SIST [12]) will provide the country's leadership with a large-scale monitoring of the dynamics of all spheral imbalances and disproportions in the country. This will allow developing an effective long-term economic, political, demographic and social policy that prevents crises and conflicts in the framework of ensuring and strengthening a lasting sustainable peace from the structural harmony of Ghana’s spherons. To this end, the country needs priority investment and the development of appropriate scientific innovations and spheral statistical digital technologies. The same conclusion is for global peace. If such researches and their practical peacemaking consequences are obvious for separate countries, then they are adequate for other countries and for the gradual provision of global peace and prosperity of all nations on the basis of scientific knowledge and governance of the spherons’ structural harmony that generate them. References: 1.Ghana Statistical Service.GSS (1986). 1984, Population Census of Ghana, (The gazette 2). 2.Ghana Statistical Service.GSS (2004). 2000 Population Census of Ghana (The gazette 3). 3.Ghana Statistical Service. GSS (2012). 2010 Population and Housing Census Summary Report of final Results. 4.Ghana Statistical Service. GSS (2012). 2010 Population and Housing Census Economic Activities in Ghana. 5.Ghana Statistical Service. GSS (2013) 2010 Population and Housing Census National Analytical Report (2013). 6.Ghana Statistical Service. GSS (2016). 2015 Labour force report. http://www.statsghana.gov.gh 7.International Standard Industrial Classification of all Economic Activities (ISIC), Rev.4. United Nations publication. ISBN: 987-92-1-161518-0. 8.Paetau Michael (2013) Niklas Luhmann and Cybernetics. Journal of Sociocybernetics. Vol 11 No 1/2 (2013): https://papiro.unizar.es/ojs/index.php/rc51-jos/article/view/790 9.Maturana, Humberto & Varela, Francisco ([1st edition 1973] 1980). Autopoiesis and Cognition: the Realization of the Living. 10.Regions of Russia. Socio-economic Indicators 2013. Statistical Collection. M: 2013 11.Semashko, Leo (2002) Tetrasociology: Responses to Challenges. –St Petersburg: http://peacefromharmony.org/?cat=en_c&key=145 12.Kashina Olga and Semashko Leo (2014) Statistics of SPHERONS of Russia for 2010: Methodology, Sources and Number: http://peacefromharmony.org/?cat=en_c&key=593 12a. Semashko Leo and 173 coauthors from 34 countries (2016) Global Peace Science (pages: 51-60): http://peacefromharmony.org/docs/global-peace-science-2016.pdf 13.Takemi, K., Jimba, M., Ishii, S., Katsuma, Y., & Nakamura, Y. (2008). Human security approach for global health. The Lancet, 372(9632), 13-14. doi: 10.1016/s0140-6736(08)60971-x 14.Hornung Bernd, Scott Bernard, Semashko Leo (2003) Tetrasociology and sociocybernetics: Towards a comparison of the key concepts: http://www.peacefromharmony.org/?cat=en_c&key=160 Stephen Amoah, MSc Statistics, PhD Applied Statistics Ghana Statistical Service, Chief Statistician, Home address: Accra, Ghana Email: stephen.amoah@statsghana.gov.gh Web:http://peacefromharmony.org/?cat=en_c&key=837 Ayo Ayoola-Amale, J.D. GHA-Africa President, GHA Int. Vice-President, Womens' GHA Co-Chair, Ghana University Professor, Nigeria & Ghana, Accra Email: aayoamale@gmail.com Web: http://peacefromharmony.org/?cat=en_c&key=524 30-07-18
----------------------------------------------------------------------------------------------------------------
3. Leo Semasko. Ghana: A scientific breakthrough in the statistical study of Spherons
Dear Steve and Ayo, I just finished a very long and difficult but very interesting and important work for me to edit your research of the Ghana’s Spherons as your full article (12 pages) on the IPRA Conference until July 31st. My editing concerned only the initial and final part of the article and only the terminology and stylistics, completely preserving all your wonderful ideas. I also did not touch your statistics and figures. But I changed the numbering of the Tables and added one reference. I also formatted the text in accordance with the scientific standards that I know. It will be published soon on the new page here:http://peacefromharmony.org/?cat=en_c&key=836 Of course, you should carefully read this text, edit it, and approve it as the final version that you must send to the IPRA Conference by July 31 and me so that I can publish it on the website and in the GHA new book: “Spherons: International Statistics”. I was happy to translate your wonderful article into Russian, which I will also publish on the website and in the new GHA book. You both could use it as a doctoral dissertation/thesis on applied statistics and publish it in all the magazines, books and sites that you can get. Your article and research is a unique scientific achievement of African science, having worldwide significance. It opens the way for a new social and humanitarian science, new economic and political digital governance in the government and new business, which we can talk about later, if you want. Your research is a new, the most perfect sample for similar studies in other countries, which I will now recommend to all. It is much better than the Russian study of the spherons in 2015 since you have raised the research of spherons to a new level in 3 years. You have outstripped all of the GHA: India, Pakistan, Kazakhstan and other countries! It is a fact. Such unprecedented scientific information, its theory and methodology are not possessed today by any Scientific Academy, no government, no national security service, no peacemaking organization, no Internet moderator and no social network other than the GHA that created it by conducting the first statistical researches of the Spherons of different countries. This is a unique scientific achievement of the 21st century, opening the way to a global digital sustainable economy, the conscious building a harmonious civilization of a new multipolar world order and global peace for the whole future. At the end of the year, after the IPRA Conference, I will recommend both of you for this study to the GHA highest honorary title: "World Harmony Creator", because your research opens the way for the scientific embodiment of the "Global Peace Science" from harmony of spherons outside of Russia, worldwide, in a practical way. Of course, I'm sure this unprecedented volunteer scientific research will bring you many other scientific, political, peacemaking, career and business honors in the future. This is an excellent example for all scientists and peacemakers of the GHA and WGHA to follow this way of statistical studies of Spherons in other countries. I sincerely, from all my heart, congratulate you on this unique scientific achievement and breakthrough. With love, Dr. Leo Semashko http://peacefromharmony.org/?cat=en_c&key=253 26-07-18
Dear friends, In addition to the past (yesterday's) information, to expand your sociocybernetic peacemaking imagination, to facilitate your analytical and explanatory functions, and to deepen your innovative holistic tetranet thinking in researching and understanding the spherons, I am pleased to send you our with Olga Kashina study of Russia spherons as another example together with the Ghana example. You are free to use from it all the necessary information: classifiers (this is the most complex and ambiguous statistical tool), tables, schemes, references, explanations, contents, title, etc. in your studies of spherons. This is natural, because we are a single scientific team in which the exchange of information only enriches us and makes our studies more effective. I'm sure our research will be useful for all colleagues. Best wishes for success in researching the spherons, opening a new page of humanitarian and peacemaking science, raising its thinking to a "substantially new level", as Einstein demanded more than 70 years ago "to survive mankind", Leo, 01-08-18 --------------------------------------------------------------------------------
Global Peace Science at the Structural Harmony Genetic Level:
Statistics of Pakistan’s Spherons for 2014-15 By Dr. Noor M. Larik Ms. Rashida Bokhari S. Mazhar H. Hashmi Zia-ul-Islam For the IPRA “Peace Theories & History Commission” Abstract The modern nature of WAR is entirely different from the WARS being happened in the past leaving not-forgettable events at individual as well as at national level. However, factors and causes are the same of the WARS of both natures. Besides, this there is another type of war, which is always in action amongst the individuals, groups, parties within the countries. Moreover, the economic classes in the societies is the main factor for such wars. It guides us to move for a system of equalities of two types i.e. financial and social. Pakistan is badly affected by disharmonious conditions in the society.The global peace harmony is much needed in the country. Now it seems the solution of such conflicts can be achieved through the "Global Peace Science", created during 11 years by the GHA international peacemaking organization. This science allows all nations to achieve this goal within the spherons’ structural harmony that make up the societal genome of every national society and humanity as a whole. Humanity’s system of harmony is needed for peace. Therefore, the global peace is rooted in the social genome of the SPHERONS and the war is devoid of any genetics, it is only a temporary, historically transient pathology of humankind. The genetic level excludes wars. The fundamental social platform for peace are SPHERONS at all levels from the family and the smallest settlement up to humanity as a whole. The discovery of SPHERONS in the GHA has been proved and now it is constantly proved by statistical studies in several countries, the number of which is growing. Keywords: spherons, global peace, social harmony, global peace science, social genome, peace genetics, statistics
Publications: http://peacefromharmony.org/?cat=en_c&key=847 http://peacefromharmony.org/?cat=en_c&key=836 CONTENTS 1. Statistical Background 2. The SPHERONS Research Methodology 3. Definition of SPHERONS (Spheral Classes of the Population) 3.1 Resources 3.2 Processes 3.3 Spheres 3.4 Spheral Classes: Spherons 4. Classification of SPHERONS and Spheral Indices in their Sociocybernetic Genome (SOCIONOME) 5. Classification by Branches of Economic Activity and Categories of Personnel 6. Concepts and definitions used in Pakistan Labour Force Survey 7. Sectoral differentiation of Spherons 7.1. SPHERONS OF PAKISTAN. Population of the Islamic Republic of Pakistan 8. Economically Active (working) and inactive (non-working) Population: P1w and P1n 9. Pakistan’s SPHERONS Statistics for 2014-15 10. SPHERONS AT PROVINCE LEVEL – KHYBER PAKTUNKHWA 11. SPHERONS Statistics for PUNJAB Province 12. SPHERONS Statistics for SINDH Province 13. SPHERONS Statistics for BALOCHISTAN Province 14. Conclusion 1. Statistical Background In Pakistan, six population censuses have so far been conducted since Independence in 1947.First four censuses conducted during 1951, 1961, 1972 and 1981. Fifth census after 17 years in 1998 and the last in 2017 after a gap of 19 years. The detailed results of which are still in process. The main reason for delay in census taking was the law and order situation in the country. The complete results of the census are yet not published. Furthermore, the latest census did not cover the employment. Therefore, in order to do the statistical research for SPHERONS based on the methodology adopted in Russian paper research work on spherons [1, 51-96], it was decided to use data of the Pakistan Labour Force Surveys. The survey provides information at the national and provincial level with urban rural break up. In this paper, the results of statistical research of Pakistan’s SPHERONS would base on the Labour Force Survey for the year, 2014-15 including gender analysis as well. The Labour Force Survey is conducted using the two stage stratified sample design. It covers almost all the country. The population of de-excluded areas contributes around 2 percent of the total population of Pakistan. The major objective of the survey is to collect the information of labour force in the country covering population by gender, education, employment and unemployment by occupation and Industry. The occupational and industrial classification used in Pakistan are comparable with the International classifications. 2. The SPHERONS Research Methodology To prepare the research on SPHERONS, the data of Pakistan Labour Force Survey 2014-15 is used [2]. The data was recoded to make it usable to calculate the SPHERONS of Pakistan. The coding scheme mainly depends upon the Pakistan Standard Occupational and Industrial Classifications issued by Pakistan Bureau of Statistics. To make the results representative at national level the weighted data has been used. In depth analysis of data of Labour Force Survey was first carried out to reach to the final results. For estimation of SPHERONS the technique elaborated in Global Peace Science published by Global Harmony Association (GHA) has been used. [3; 4; 5; 6] 3. Definition of SPHERONS (Spheral Classes of the Population) SPHERONS consist of people employed in different spheres. This is the natural human diversity of SPHERONS and SPHERONS’ diversity of people is a spontaneous inner law of society. The person simultaneously belongs to all SPHERONS, as each day he/she is employed in every sphere at least the minimum time passing from one sphere to another. SPHERONS (harmonious spheral classes) are the permanent, eternal, extremely large groups of population, including all people without exception, differing in the main on time employment in one of the four spheres of society. They produce four necessary and sufficient for the life of society and individual clusters of spheral resources: People, Information, Organizations and Things (material goods and services). Briefly, it is the PIOT resources, the main from which is people, which alone produce all resources including themselves. 3.1 Resources The harmonious existence of a society in any place and at any time is defined by the measure in proportion of four necessary and sufficient social resources: People (P). Information (I). Organizations (O) and Things (T). (Things are any material benefits and services). This Axiom of social harmony is the source for science of social harmony, which is the fundament for Global Peace Science (GPS). There is a need of continuity in PIOT resources, mutual inclusion "each in each". So these resources are dependable on each other. Therefore, it is impossible to produce one without the others. The totality of PIOT resources constitute society in a whole, i.e. S (society) = P + I + O +T. [1]
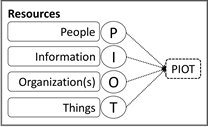
3.2 Processes
The spheres of production correspond to the four PIOT resources. These spheres combined four necessary processes: production, distribution, exchange (market) and consumption (PDEC) with the necessary parts of PIOT resources, including four SPHERONS employed in these spheres.
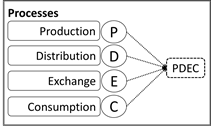
3.3 Spheres The four spheres of production are: 1. Social sphere, or Sociosphere (S), the subject and the product of which are people (P); 2. Information sphere, or Infosphere (I), the subject and the product of which is information (I); 3. Organizational sphere, or Orgsphere (O), the subject and the product of which are organization/s (O); 4. Technical (economic/ecological) sphere, or Technoecosphere (T), the subject and the product of which are things (T).
Spheres as the societal macrostructures cover all levels of the social world from macro (humanity) to micro (individual). 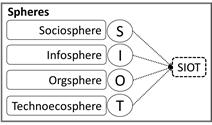 3.4 Spheral Classes: Spherons People employed in the SIOT productive spheres constitute four spheral classes, which briefly titled Spherons. Therefore, spheral classes and Spherons are synonyms. Four Spherons as the four productive spheral classes producing PIOT resources are: Sociospheron, Infospheron, Orgspheron and Technospheron. SPHERONS are actors of global peace, its ultimate cause, source and guarantee. Total population is the sum of people employed in these four SPHERONS:P = P1 + P2 + P3 + P4
Therefore, the number of all population/people in Pakistan as in any country (city, province, corporation and in humanity in a whole) is: P =P1 + P2 + P3 + P4 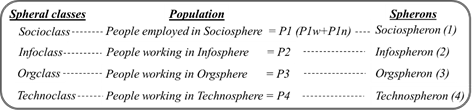 1.People/population (P) is the product of Sociosphere. People/population is produced for four spheres, therefore P = PI + P2 + P3 + P4, Where: PI - is employed in Sociosphere; PI constitutes Spherons-1 or SOCIOCLASS, P2 - is employed in Info sphere; P2 constitutes Spherons -2 or INFOCLASS; P3 - is employed in Orgsphere; P3 constitutes Spherons -3 or ORGCLASS: P4 - is employed in Techno sphere; P4 constitutes Spherons -4 or TECHNOCLASS. 2.The employed in Sociosphere (P1), i.e. SFERON-1 consists of two parts: a.the professionals working in social sector of this sphere (P1w) and b.all non-working (P1n) employed in the individual sector with self-production (pre-school children, students, housewives, non-working pensioners, disabled unemployed, etc.) and in the households. Therefore, the number of SPHERON-1 is the sum of employed in all sectors of this sphere: P1 = P1w + P1n. 3.To every SPHERONS a socially useful labor corresponds: P1w are employed by humanitarian labor, P2 - information labor, P3 - organizational labor, and P4 - material labor.
4. Classification of SPHERONS, Spheral Indices in their Sociocybernetic Genome (SOCIONOME) The purpose of this study is to determine the number of each SPHERON in Pakistan during 2014-15, the sum of which would be the total population of Pakistan. SPHERONS, as a whole, and the individuals who make them differ by main (on time) employment in one of the four spheres of society. Employment defines each person’s universal life characteristics from birth to death. All the time within people’s lives are devoted to produce various social resources. Within multidimensional topology of vital employment of people vary its two principal clusters: 1. Self-production or self-employment by person himself 2. Labor or economic employment of people by other resources except self-employed. The above two clusters of employment divide the entire population into two parts: 1. Nonworking (economically inactive) population employed in Sociosphere by self-production. 2. Working or economically active population employed in all spheres. The above two parts consist of special spheral indices of SPHERONS P.Population/people in general; P1.Socioclass who are employed in Sociosphere (first sphere); P1n.Non-working population who are employed in self-production of Sociosphere and forming part of the Socioclass; P1w.Working population who are employed in various branches/field of industries of Sociosphere and who constitute another part of the Socioclass.Therefore P1 = P1n + P1w. P2.Infoclass who are employed in branches of Infosphere (second sphere); P3.Orgclass who are employed in branches of Orgsphere (third sphere); P4.Technoclass who are employed in branches of Techno sphere (economic, fourth sphere). Each spheral class is a separate SPHERON covering part of the population employed in one of the four spheres of social production. The sum, of the number of people in the four SPHERONS is the population as a whole, which can be expressed as under: Population/People = Socioclass (non-workers + workers) + Infoclass + Orgclass + Technoclass. Symbolically, P = P1 (P1n + P1w) + P2 + P3 + P4 The spheral indices, which was used to express SPHERONS, are defined as follows: Table 1: Spheral indices of Spherons
P | Population/people in general for any level and any community from family, school and town up to country and the world. | P1 | Socioclass, Spheron-1, who are employed (working and nonworking) in the branches of sociosphere (first sphere); | P1n | Non-working population, who are employed in self-production (‘autopoiesis”, Maturana)of sociosphere and forming the Spheron-1first part; | P1w | Working population in the branches of Sociosphere and who constitute the Spheron-1 second part. Therefore, P1 = P1n + P1w; | P2 | Infoclass, Spheron-2, who are working in branches of Infosphere (second sphere); | P3 | Orgclass, Spheron-3, who are working in branches of Orgsphere (third sphere); | P4 | Technoclass, Spheron-4, who are working in branches of Technosphere (economic, fourth sphere). |
Schematically, the sociocybernetic genome of the structural harmony of spherons’ global peace is represented as follows. Scheme. Sociocybernetic GENOME of Spheres and Spherons’ Structural Harmony
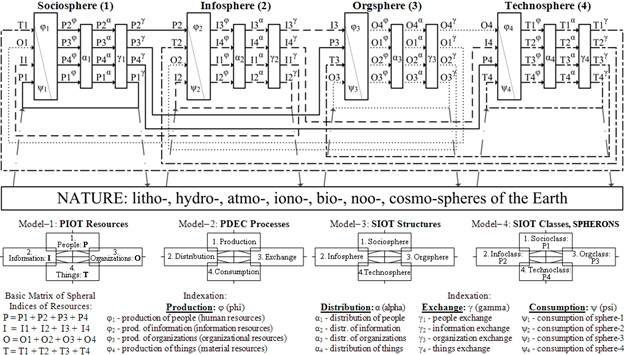
More details on SOCIONOME see [The ABC of Harmony for World Peace, 38-43: http://peacefromharmony.org/?cat=en_c&key=486and Video: http://youtu.be/hbxY5lREOeA It is obvious that the key role in the socionome among its 16 fundamental elements belongs to the Spherons who constantly reproduce it as bees in the swarm processes, therefore their statistical research at all levels, especially at the national level, is crucial for establishing peace in each country, and hence at the global level. only to this research is devoted our work. 5. Classification by Branches of Economic Activity and Categories of Personnel This study covers the statistical classifications of labour force as under: 1. Economic activity; 2. Industries/branches/types/kinds of economic activity (activities); These classifications are of the great help to define SPHERONS employed in four spheres, according to the number of employees in the industries of each sphere. 6. Concepts and definitions used in Pakistan Labour Force Survey:
A brief explanation of the key concepts and definitions follows.
Household constitutes all those persons who usually live together and share their meals. A household may consist of one person or more who may or may not be related to each other.
Economically Active Population comprises all persons of either sex who provide labour services for the production of goods and services as defined by the United Nation System of National Accounts, during the reference period.The production of goods and services includes:
i) All production and processing of primary products whether for the market, barter or, own consumption. ii) The production of all other goods and services for the market. iii) The households which produce such goods and services for the market and own consumption. v) Own account construction. Currently Active Population or labour force comprises all persons ten years of age and above who fulfill the requirements for including among employed or unemployed during the reference period i.e. one week preceding the date of interview.
Crude activity rate is the currently active population expressed as a percentage of the total population in Pakistan.
Refined activity rate is the currently active population expressed as a percentage of the population 10 years and above.This rate enables international comparison by factoring in the effect of age composition.
Employment comprises all persons ten years of age and above who worked at least one hour during the reference period and were either “paid employed” or “self-employed”. Persons employed on permanent/regular footings have not worked for any reason during the reference period are also treated as employed, regardless of the duration of the absence or whether workers continued to receive a salary during the absence.The survey obtains information on the duration of absence as well as on other formal job attachment characteristics of workers in paid and self-employment.
Occupation refers to the type of work done during the reference period by the persons employed (or the kind of work done previously if unemployed), irrespective of the industry or the status in employment of the person. It provides description of a person’s job.Occupation is classified according to the Pakistan Standard Classification of Occupations based on the International Standard Classification of Occupations, ISCO-2015.
Industry means the activity of the firm, office establishment or department in which a person is employed or the kind of business, which he/she operates. The activity is defined in terms of the kind of goods produced or services supplied by the unit in which the person works.Industry is classified according to Pakistan Standard Industrial Classification (PSIC) 2007.
Self-employment job is a job where the remuneration is directly dependent upon the profits, or the potential profits, derived from the goods and services produced.
Status in Employment refers to the type of explicit or implicit contract of employment of the person with other persons or organization. Status of an economically active individual with respect to his employment i.e. whether he/she is an employer, own account worker, employee or unpaid family worker is defined as follows:-
Employee is a person who works for a public or private employer and receives remuneration in wages, salary, commission, tips, piece rates or pay in kind.Employees are divided into • Regular paid employees with fixed wage • Casual paid employee • Paid worker by piece rate or work performed • Paid non-family apprentice
Employer is a person working during the reference period, on own-account or with one or a few partners at a “self-employment job” with one or more employees engaged on a continuous basis.
Own account worker is a person working during the reference period, on own-account or with one or more partners at a “self-employment job”, without any employee engaged on a continuous basis; but, possibly, with one or more contributing family workers or employees engaged on an occasional basis. It includes owner cultivator, share cropper and contract cultivator.
Unpaid family worker is a person who works without pay in cash or in kind on an enterprise operated by a member of his/her household or other related persons.
Other includes member of a producer’s cooperative, etc.
Underemployment (Time-related) comprises all employed persons who during the reference period satisfied the following two criteria simultaneously:
i) Worked less than 35 hours per week, ii) Sought or were available for alternative or additional work.
Underemployment (Time-related) Rate is the time related underemployed population expressed as a percentage of the currently active population.
Unemployment in Pakistan comprises all persons ten years of age and above who during the reference period were:
i) “Without work” i.e. who were not in paid-employment or self-employment; and ii) “Currently available for work” i.e. were available for paid employment or self-employment: or iii) Not currently available for the following reasons: illness, will take a job within a month, is temporarily laid off, is an apprentice and is not willing to work: or iv) seeking work during last week.
Economically active population:According to Pakistan Labour Force Survey the economically active population includes persons aged 10 years and above who, were employed for economic activity during previous week of the survey or looking for work this economically active population is divided into two categories i.e. employed or unemployed. Not in labour force are the persons not looking for work such as students, household women etc. are included in P1n of Socioclass as one of SPHERONS. Table 2: Pakistan Standard Occupations Classification
Code | Major Group | Code | Description | 1 | Managers | 11 | Chief executives, senior officials and legislators | 12 | Administrative and commercial managers | 13 | Production and specialized services managers | 14 | Hospitality, retail and other services managers | 2 | Professionals | 21 | Science and engineering professionals | 22 | Health professionals | 23 | Teaching professionals | 24 | Business and administration professionals | 25 | Computer related data base and software engineering professionals | 26 | Legal, social and cultural professionals | 3 | Scientists | 31 | Science and engineering associate professionals | 32 | Health associate professionals | 33 | Business and administration associate professionals | 34 | Legal, social, cultural and related associate professionals | 35 | Information and communications technicians | 4 | Clerical support workers | 41 | General and keyboard clerks | 42 | Customer services clerks | 43 | Numerical and material recording clerks | 44 | Other clerical support workers | 5 | Service and sales workers | 51 | Personal Services | 52 | Sales workers | 53 | Personal care workers | 54 | Protective services workers | 6 | Skilled agricultural, forestry and fishery workers | 61 | Market-oriented skilled agricultural workers | 62 | Market-oriented skilled forestry, fishery and hunting workers | 63 | Subsistence farmers, fishers, hunters and gatherers | 7 | Craft and related trades workers | 71 | Building and related trades workers, excluding electricians | 72 | Metal, machinery and related trades workers | 73 | Handicraft and printing workers | 74 | Electrical and electronic trades workers | 75 | Food processing, wood working, garment and other craft and related trades workers | 8 | Plant and machine operators, and assemblers | 81 | Stationary plant and machine operators | 82 | Assemblers | 83 | Drivers and mobile plant operators | 9 | Elementary occupations | 91 | Cleaners and helpers | 92 | Agricultural, forestry and fishery laborers | 93 | Laborers in mining, construction, manufacturing and transport | 94 | Food preparation assistants | 95 | Street and related sales and service workers | 96 | Refuse workers and other elementary workers | 0 | Armed forces occupations | 01 | Commissioned armed forces officers | 02 | Non-commissioned armed forces officers | 03 | Armed forces occupations, other ranks |
7. Sectoral differentiation of Spherons
Sectoral/branch differentiation and classification of spheres and spherons are presented in detail in the tables of their statics, which play the role of corresponding spheral/spherons classifiers: http://peacefromharmony.org/docs/global-peace-science-2016.pdf (pp. 32-36). Based on these tables, here we only list the working population groups, which are employed in the relevant spheres and constitute the corresponding spherons. P1. Socioclass/Sociospheron: it includes the non-working population (P1n) and the working one (P1w) in the Sociosphere (first sphere). It is people working in branches/institutions of health, education, sports, tourism, social welfare, life insurance, emergency situations, religious, trade union, charity, volunteer and similar organizations that provide direct services to human/people. In these branches/institutions, human/people constitute the subject and product of their activity, in which they differ from other spherons. P2. Infoclass/Infospheron: it includes the working population in the Infosphere (second sphere), in its branches/institutions: Culture, science, art, media, publishing houses, advertising, design, communication, and any information service. In these branches/institutions, information constitutes the subject and product of their activity, in which they differ from other spherons. P3. Orgclass/Orgspheron: it includes the working population in the Orgsphere (third sphere), in its branches/institutions: Administration, law, defense, security agencies, taxes, customs, banking and financial structures, political and public organizations. In these branches/institutions, organization is the subject and product of their activity, in which they differ from other spherons. P4. Technoclass/Technospheron: it includes the working population in the Technosphere (the fourth sphere), in its branches/institutions: Industry, agriculture, forestry and fisheries, construction, transport, trade, utilities and consumer services, environmental protection and ecology. In these branches/institutions, things and material services constitute the subject and product of their activity, in which they differ from other spherons. 7.1. SPHERONS OF PAKISTAN. Population of the Islamic Republic of Pakistan According to the Population Census, 2017 the population of Pakistan was 207.77 million, which was 132.01 million according to population census 1998. The population for the other years in between the Censuses is based on the population projections made by the technical committee formed by the Planning and Development Division of the Government of Pakistan, and officially being used by the Government. The population used for this study is based on the population projections made in 2007 (maybe in 2014-15?). 8. Economically Active (working) and inactive (non-working) Population: P1w The population projections provide estimates by gender, area, and broad age groups. The population estimates for the year 2014-15 used for the following exercise. Table below provides the estimated economically active (working) and inactive (nonworking) population by the age groups: Table 3: Economically Active (working) and inactive (non-working) population (in thousands) Age group | Population | Total | Active | Inactive | Male | Female | Total | Male | Female | Total | Male | Female | Total | 1 < 10 years | 0 | 0 | 0 | 28,046 | 26,154 | 54,200 | 28,046 | 26,154 | 54,200 | 2 10 to 60 years | 21,925 | 11,502 | 33,427 | 98 | 38,797 | 38,895 | 22,023 | 50,299 | 72,322 | 3 60 Years and above | 2,432 | 715 | 3,147 | 2 | 2,201 | 2,203 | 2,434 | 2,916 | 5,350 | Total | 24,357 | 12,217 | 36,574 | 28,146 | 67,152 | 95,298 | 52,502 | 79,370 | 131,872 |
Table 4:Percent distribution of population Age group | Population | Total | Active | Inactive | Male | Female | Total | Male | Female | Total | Male | Female | Total | 1 < 10 years | 0.00 | 0.00 | 0.00 | 21.27 | 19.83 | 41.10 | 21.27 | 19.83 | 41.10 | 2 10 to 60 years | 16.63 | 8.72 | 25.35 | 0.07 | 29.42 | 29.49 | 16.70 | 38.14 | 54.84 | 3 60 Years and above | 1.84 | 0.54 | 2.38 | 0.01 | 1.67 | 1.68 | 1.85 | 2.21 | 4.06 | Total | 18.47 | 9.26 | 27.73 | 21.35 | 50.92 | 72.27 | 39.81 | 60.19 | 100.00 |
Figure 1: Economically Active and Inactive Population
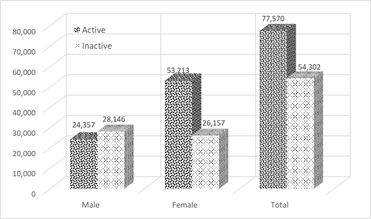
9. Working Population (P1w)
Table 5: Number of SPHERONS (Population in thousands) Spheral Indices | The Employed in Branches of Four Spheres | 2014-15 | Percentage of | Male | Female | Both | Total Population | Total Employed Population | P | All Population of Pakistan: P = P1+P2+P3+P4 | 96,478 | 92,712 | 189,190 | 100.0 | 100.0 | P1 | SOCIOCLASS: PI = Plw + Pin | 64,177 | 80,915 | 145,091 | 76.7 | - | P1w | Plw = sum of working in the branches of Sociosphere | 11,674 | 1,545 | 13,219 | 7.0 | 23.1 | | PEducation | 1,096 | 787 | 1,883 | 1.0 | 3.3 | | QHuman health and social work activities | 276 | 159 | 435 | 0.2 | 0.8 | | Other | 10,302 | 599 | 10,901 | 5.8 | 19.0 | P1n | P1n = Sum of non-working, economically inactive population | 52,502 | 79,370 | 131,872 | 69.7 | - | | Age group < 10 years | 28,046 | 26,154 | 54,200 | 28.6 | - | | Age group 10 to 60 years | 98 | 2 | 100 | 0.1 | - | | Age group 10 to 60 years | 21,925 | 50,297 | 72,222 | 38.2 | - | | Age group 61 and older, inactive | 2 | 0 | 2 | 0.0 | - | | Age group 61 and older, active | 2,432 | 2,916 | 5,348 | 2.8 | - | P2 | INFOCLASS = sum of working in the branches of Infosphere | 261 | 5 | 267 | 0.1 | 0.5 | P3 | ORGCLASS = sum of working in the branches of Orgsphere | 1,456 | 44 | 1,499 | 0.8 | 2.6 | | O Public administration and defence; compulsory social security | 224 | 5 | 229 | 0.1 | 0.4 | | K Financial and insurance activities | 132 | 4 | 136 | 0.1 | 0.2 | | Other | 1,099 | 35 | 1,134 | 0.6 | 2.0 | P4 | TECHNOCLASS = sum of working in the branches of Technosphere | 30,584 | 11,748 | 42,333 | 22.4 | 73.9 | | AAgriculture, forestry and fishing | 14,304 | 9,397 | 23,701 | 12.5 | 41.4 | | CManufacturing | 6,282 | 1,876 | 8,158 | 4.3 | 14.2 | | FConstruction | 4,039 | 25 | 4,065 | 2.1 | 7.1 | | GWholesale and retail trade; repair of motor vehicles and motorcycles | 1,263 | 30 | 1,293 | 0.7 | 2.3 | | Others | 4,696 | 420 | 5,116 | 2.7 | 8.9 |
The analysis of spheral classes shows that the majority of the population placed in the technoclass, Pakistan’s economy basically depends on agriculture, where 41percent of the population is involved, followed by the manufacturing which is mostly have the agro-based industries. The sociosphere like health and education, which basically for the human development is far below the actual requirement of the population. More than 40 percent of the population is illiterate, and about 35 percent of the children under five years facing stinting growth problems.
Figure 2: Working Population in Spheral Classes
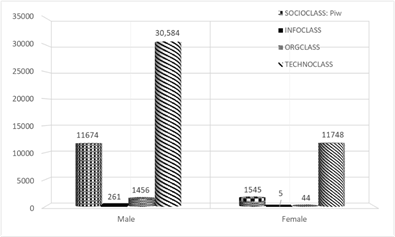
10. SPHERONS AT PROVINCE LEVEL – KHYBER PAKTUNKHWA 10.1. Population of the Khyber Pakhtunkhwa(KPK) According to the projections the population of KPK was 26.37 million in 2014-15. The KPK is the third largest Province in terms of population. 10. 2. Economically Active and in-active Population The economically active (working) and inactive (nonworking) population with broad age groups by gender of KPK for the year 2014-15 is presented below: Table 6:Economically Active (working) and inactive (non-working) population (in thousands) Age group | Population | Total | Active | Inactive | Male | Female | Total | Male | Female | Total | Male | Female | Total | 1 < 10 years | 0 | 0 | 0 | 4,336 | 3,862 | 8,198 | 4,336 | 3,862 | 8,198 | 2 10 to 60 years | 3,583 | 635 | 4,218 | 12 | 7,134 | 7,146 | 3,595 | 7,769 | 11,364 | 3 60 Years and above | 360 | 151 | 511 | 0 | 215 | 0 | 360 | 366 | 726 | Total | 3,943 | 786 | 4,729 | 4,348 | 11,211 | 15,559 | 8,291 | 11,997 | 20,288 |
Table 7:Percent distribution of Population KPK Age group | Population | Total | Active | Inactive | Male | Female | Total | Male | Female | Total | Male | Female | Total | 1 < 10 years | 0.00 | 0.00 | 0.00 | 21.37 | 19.04 | 40.41 | 21.37 | 19.04 | 40.41 | 2 10 to 60 years | 17.66 | 3.13 | 20.79 | 0.06 | 35.17 | 35.23 | 17.72 | 38.30 | 56.02 | 3 60 Years and above | 1.77 | 0. 74 | 2.51 | 0.00 | 1.06 | 0.00 | 1.77 | 1.80 | 3.58 | Total | 19.43 | 3.87 | 23.30 | 21.43 | 55.27 | 76.70 | 40.86 | 59.14 | 100.00 |
Almost similar pattern of active and inactive population by gender is observed in KPK as at the national level. 10.3. Working Population (KPK) As per population projection the estimated population of KPK Province during 2014-15 was 26.37 million, Socioclass engaged 30 percent of the population in KPK, of which only one percent were employed in health and social work activities, while 5 percent in education. More emphasis is required in the health sphere. 10.4. SPHERONS of Khyber Pakhtunkhwa (KPK) Province, 2014-15 Table 8: Number of SPHERONS of Population in thousands Spheral Indices | The Employed in Branches of Four Spheres | 2014-15 | Percentage of | Male | Female | Both | Total Population | Total Employed Population | P | All Population of KPK: P = P1+P2+P3+P4 | 13,281 | 13,086 | 26,367 | 100.0 | 100.0 | P1 | SOCIOCLASS: PI = Plw + Pin | 9,826 | 12,298 | 22,124 | 83.9 | - | P1w | Plw = sum of working in the branches of Sociosphere | 1,536 | 301 | 1,837 | 7.0 | 30.2 | | PEducation | 216 | 100 | 316 | 1.2 | 5.2 | | QHuman health and social work activities | 39 | 24 | 63 | 0.2 | 1.0 | | Other | 1,282 | 177 | 1,459 | 5.5 | 24.0 | P1n | P1n = Sum of non-working, economically inactive population | 8,290 | 11,997 | 20,287 | 76.9 | | | Age group < 10 years | 4,336 | 3,862 | 8,197 | 31.1 | | | Age group 10 to 60 years | 12 | 0 | 13 | 0.0 | | | Age group 10 to 60 years | 3,583 | 7,769 | 11,351 | 43.1 | | | Age group 61 and older, inactive | 0 | 0 | 0 | 0.0 | | | Age group 61 and older, active | 360 | 366 | 726 | 2.8 | | P2 | INFOCLASS = sum of working in the branches of Infosphere | 37 | 0 | 37 | 0.1 | 0.6 | P3 | ORGCLASS = sum of working in the branches of Orgsphere | 110 | 6 | 116 | 0.4 | 1.9 | | O Public administration and defence; compulsory social security | 20 | 1 | 21 | 0.1 | 0.4 | | K Financial and insurance activities | 4 | 1 | 5 | 0.0 | 0.1 | | Other | 86 | 4 | 90 | 0.3 | 1.5 | P4 | TECHNOCLASS = sum of working in the branches of Technosphere | 3,309 | 782 | 4,090 | 15.5 | 67.3 | | AAgriculture, forestry and fishing | 1,164 | 644 | 1,808 | 6.9 | 29.7 | | CManufacturing | 543 | 116 | 659 | 2.5 | 10.8 | | FConstruction | 736 | 4 | 740 | 2.8 | 12.2 | | GWholesale and retail trade; repair of motor vehicles and motorcycles | 148 | 2 | 150 | 0.6 | 2.5 | | Other | 717 | 16 | 733 | 2.8 | 12.1 |
11. SPHERONS Statistics for Punjab Province 11.1. Population of the Punjab Punjab province is the largest province in terms Population having about 54 percent of the total population of Pakistan, the estimated population for the year 2014-15 was 102.75 million. Fifty-four percent of the economically active population falls in the age group 10-60 years. 11.2. Economically Active (working) and inactive (non-working) population (in thousands) Thirty-eight percent of the female population in age group 10-60 years were available for work, however, did not have the jobs. Table 9:Economically Active (working) and inactive (non-working) population (in thousands) Age group | Population | Total | Active | Inactive | Male | Female | Total | Male | Female | Total | Male | Female | Total | 1 < 10 years | 0 | 0 | 0 | 14,321 | 13,505 | 27,826 | 14,321 | 13,505 | 27,826 | 2 10 to 60 years | 11,231 | 8,516 | 19,747 | 48 | 17,494 | 17,542 | 11,279 | 26,010 | 37,289 | 3 60 Years and above | 1,552 | 357 | 1,909 | 1 | 1,618 | 1,619 | 1,553 | 1,975 | 3,528 | Total | 12,783 | 8,873 | 21,656 | 14,370 | 32,617 | 46,987 | 27,153 | 41,490 | 68,643 |
Table 10:Percent distribution of Population Age group | Population | Total | Active | Inactive | Male | Female | Total | Male | Female | Total | Male | Female | Total | 1 < 10 years | 0.00 | 0.00 | 0.00 | 20.87 | 19.67 | 40.54 | 20.86 | 19.67 | 40.54 | 2 10 to 60 years | 16.36 | 12.41 | 28.77 | 0.07 | 25.48 | 25.55 | 16.43 | 37.89 | 54.32 | 3 60 Years and above | 2.26 | 0.52 | 2.78 | 0.00 | 2.36 | 2.36 | 2.26 | 2.88 | 5.14 | Total | 18.62 | 12.93 | 31.55 | 20.94 | 47.51 | 68.45 | 39.56 | 60.44 | 100.00 |
11.3. Working Population Of the total economically active population in Punjab, only 20 percent are employed in sociosphere, only 3 percent in education and less than one percent in human health and social activities, which is even less as compared to the province of KPK. Indicates more human development problems in Punjab as compared to KPK. The technoclass sphere engaged 76 percent of the employed labour force in Punjab, of these 44 percent in agriculture and 15 percent in manufacturing. 11.4 SPHERONS of Punjab Province, 2014-15 Table 11: Number of SPHERONS (Population in thousands) Spheral Indices | The Employed in Branches of Four Spheres | 2014-15 | Percentage of | Male | Female | Both | Total Population | Total Employed Population | P | Total Population of Punjab: P = P1+P2+P3+P4 | 51,526 | 51,220 | 102,746 | 100.0 | 100.0 | P1 | SOCIOCLASS: PI = Plw + Pin | 33,114 | 42,491 | 75,606 | 73.6 | - | P1w | Plw = sum of working in the branches of Sociosphere | 5,961 | 1,002 | 6,963 | 6.8 | 20.4 | | PEducation | 451 | 543 | 994 | 1.0 | 2.9 | | QHuman health and social work activities | 156 | 89 | 245 | 0.2 | 0.7 | | Other | 5,354 | 370 | 5,724 | 5.6 | 16.8 | P1n | P1n = Sum of non-working, economically inactive population | 27,153 | 41,490 | 68,643 | 66.8 | - | | Age group < 10 years | 14,321 | 13,505 | 27,826 | 27.1 | - | | Age group 10 to 60 years | 48 | 2 | 50 | 0.0 | - | | Age group 10 to 60 years | 11,231 | 26,008 | 37,239 | 36.2 | - | | Age group 61 and older, inactive | 1 | 0 | 1 | 0.0 | - | | Age group 61 and older, active | 1,552 | 1,975 | 3,527 | 3.4 | - | P2 | INFOCLASS = sum of working in the branches of Infosphere | 156 | 3 | 158 | 0.2 | 0.5 | P3 | ORGCLASS = sum of working in the branches of Orgsphere | 765 | 26 | 791 | 0.8 | 2.3 | | O Public administration and defence; compulsory social security | 102 | 2 | 104 | 0.1 | 0.3 | | K Financial and insurance activities | 55 | 1 | 56 | 0.1 | 0.2 | | Other | 608 | 22 | 630 | 0.6 | 1.8 | P4 | TECHNOCLASS = sum of working in the branches of Technosphere | 17,491 | 8,700 | 26,191 | 25.5 | 76.8 | | AAgriculture, forestry and fishing | 8,193 | 7,005 | 15,198 | 14.8 | 44.6 | | CManufacturing | 3,986 | 1,334 | 5,321 | 5.2 | 15.6 | | FConstruction | 2,164 | 17 | 2,180 | 2.1 | 6.4 | | GWholesale and retail trade; repair of motor vehicles and motorcycles | 803 | 27 | 831 | 0.8 | 2.4 | | Other | 2,345 | 317 | 2,662 | 2.6 | 7.8 |
12. SPHERONS Statistics for SINDH Province 12.1. Population of the Sindh The Sindh is the second largest province of Pakistan in terms of population, the estimated population for the year 2014-15 was 46. 8 million, which is about 24 percent of the total population of the country. 12.2. Economically Active (working) and inactive (non-working) population (in thousands) Thirty three million (71 percent) of the total population in Sindh is either not economically active. Fifty-seven percent of the population is in age group 10-60 years. Six percent of the female population in age group 10-60 years were available for work, however, did not have jobs. Table 12: Economically Active (working) and inactive (non-working) population (in thousands) Age group | Population | Total | Active | Inactive | Male | Female | Total | Male | Female | Total | Male | Female | Total | 1 < 10 years | 0 | 0 | 0 | 6,949 | 6,541 | 13,491 | 6,949 | 6,541 | 13,491 | 2 10 to 60 years | 5,463 | 1,991 | 7,454 | 35 | 11,354 | 11,389 | 5,498 | 13,345 | 18,843 | 3 60 Years and above | 401 | 54 | 455 | 1 | 410 | 411 | 402 | 464 | 866 | Total | 5,864 | 13,809 | 19,673 | 6,986 | 6,541 | 13,527 | 12,849 | 20,350 | 33,200 |
Table 13:Percent distribution of Population Age group | Population | Total | Active | Inactive | Male | Female | Total | Male | Female | Total | Male | Female | Total | 1 < 10 years | 0.00 | 0.00 | 0.00 | 20.93 | 19.70 | 40.64 | 20.93 | 19.70 | 40.64 | 2 10 to 60 years | 16.46 | 6.0 | 22.46 | 0.10 | 34.20 | 34.30 | 16.56 | 40.20 | 56.76 | 3 60 Years and above | 1.21 | 0.16 | 1.37 | 0.01 | 1.23 | 1.23 | 1.21 | 1.40 | 2.61 | Total | 17.67 | 6.16 | 23.83 | 21.04 | 55.13 | 76.17 | 38.71 | 61.29 | 100.00 |
12.3. Working Population- SINDH About a quarter of the total employed population were in sociosphere in Sindh during 2014-2015, of these 3.2 percent employed in education and less than one percent in the health and social work activities. These two important spheres of human development appear to be the neglected areas. Technosphere employed 70 percent of the employed labour force in Sindh, of these 39 percent in agriculture and 13 percent in manufacturing. 12.4. SPHERONS of Sindh Province Table 14: Number of SPHERONS (Population in thousands) Spheral Indices | The Employed in Branches of Four Spheres | 2014-15 | Percentage of | Male | Female | Both | Total Population | Total Employed Population | P | All Population of Sindh: P = P1+P2+P3+P4 | 24,571 | 22,238 | 46,809 | 100.0 | 100.0 | P1 | SOCIOCLASS: PI = Plw + Pin | 16,161 | 20,524 | 36,685 | 78.4 | | P1w | Plw = sum of working in the branches of Sociosphere | 3,312 | 173 | 3,485 | 7.4 | 25.6 | | PEducation | 328 | 102 | 430 | 0.9 | 3.2 | | QHuman health and social work activities | 59 | 36 | 94 | 0.2 | 0.7 | | Other | 2,925 | 36 | 2,961 | 6.3 | 21.8 | P1n | P1n = Sum of non-working, economically inactive population | 12,849 | 20,350 | 33,200 | 70.9 | | | Age group < 10 years | 6,949 | 6,541 | 13,491 | 28.8 | | | Age group 10 to 60 years | 35 | 0 | 35 | 0.1 | | | Age group 10 to 60 years | 5,463 | 13,345 | 18,808 | 40.2 | | | Age group 61 and older, inactive | 1 | 0 | 1 | 0.0 | | | Age group 61 and older, active | 401 | 464 | 864 | 1.8 | | P2 | INFOCLASS = sum of working in the branches of Infosphere | 56 | 1 | 57 | 0.1 | 0.4 | P3 | ORGCLASS = sum of working in the branches of Orgsphere | 440 | 9 | 449 | 1.0 | 3.3 | | O Public administration and defence; compulsory social security | 67 | 1 | 68 | 0.1 | 0.5 | | K Financial and insurance activities | 65 | 1 | 66 | 0.1 | 0.5 | | Other | 308 | 7 | 315 | 0.7 | 2.3 | P4 | TECHNOCLASS = sum of working in the branches of Technosphere | 7,914 | 1,704 | 9,618 | 20.5 | 70.7 | | AAgriculture, forestry and fishing | 3,897 | 1,428 | 5,325 | 11.4 | 39.1 | | CManufacturing | 1,599 | 204 | 1,803 | 3.9 | 13.2 | | FConstruction | 915 | 2 | 917 | 2.0 | 6.7 | | GWholesale and retail trade; repair of motor vehicles and motorcycles | 252 | 0 | 252 | 0.5 | 1.9 | | Other | 1,251 | 70 | 1,320 | 2.8 | 9.7 |
13. SPHERONS Statistics for BALOCHISTAN Province 13.1. Population of the Balochistan Balochistan is the largest province in terms of area, having only 7 percent of the total population of the country. The estimated population of Balochistan was 13.268 million in 2014-2015. . 13.2. Economically Active (working) and inactive (non-working) population (in thousands) Table 15:Economically Active (working) and inactive (non-working) population (in thousands) Age group | Population | Total | Active | Inactive | Male | Female | Total | Male | Female | Total | Male | Female | Total | 1 < 10 years | 0 | 0 | 0 | 2,439 | 2,247 | 4,686 | 2,439 | 2,247 | 4,686 | 2 10 to 60 years | 1,649 | 360 | 2,009 | 2 | 2,815 | 2817 | 1,651 | 3,175 | 4,826 | 3 60 Years and above | 119 | 36 | 155 | 0 | 76 | 76 | 119 | 112 | 231 | Total | 1,768 | 396 | 2,164 | 2,441 | 5,138 | 7579 | 4,210 | 5,533 | 9,743 |
Table 16:Percent distribution of Population Age group | Population | Total | Active | Inactive | Male | Female | Total | Male | Female | Total | Male | Female | Total | 1 < 10 years | 0.00 | 0.00 | 0.00 | 25.04 | 23.06 | 48.10 | 25.04 | 23.06 | 48.10 | 2 10 to 60 years | 16.93 | 3.69 | 20.62 | 0.02 | 28,89 | 0.02 | 16.95 | 32.59 | 49.54 | 3 60 Years and above | 1.22 | 0.37 | 1.59 | 0.00 | 0.78 | 0.00 | 1.22 | 1.15 | 2.37 | Total | 18.15 | 4.06 | 22.21 | 25.06 | 52.73 | 77.79 | 43.21 | 56.79 | 100.00 |
13.3. Working Population (P1n) Sixty-nine percent of the total employed population were in technosphere, of these, 39 percent in agriculture and10 percent in the manufacturing. Sociosphere employed 27 percent during 2014-2015. Less than one percent were employed in the human health and social work activities. 13.4. SPHERONS of Balochistan Province, 2014-15 Table 17: SPHERONS (Population in thousands) Spheral Indices | The Employed in Branches of Four Spheres | 2014-15 | Percentage of | Male | Female | Both | Total Population | Total Employed Population | P | All Population of Balochistan: P = P1+P2+P3+P4 | 7,100 | 6,168 | 13,268 | 100.0 | 100.0 | P1 | SOCIOCLASS: PI = Plw + Pin | 5,075 | 5,602 | 10,677 | 80.5 | - | P1w | Plw = sum of working in the branches of Sociosphere | 865 | 69 | 934 | 7.0 | 26.5 | | PEducation | 101 | 42 | 143 | 1.1 | 4.1 | | QHuman health and social work activities | 22 | 11 | 33 | 0.2 | 0.9 | | Other | 742 | 16 | 758 | 5.7 | 21.5 | P1n | P1n = Sum of non-working, economically inactive population | 4,210 | 5,533 | 9,743 | 73.4 | - | | Age group < 10 years | 2,439 | 2,247 | 4,686 | 35.3 | - | | Age group 10 to 60 years | 2 | 0 | 2 | 0.0 | - | | Age group 10 to 60 years | 1,649 | 3,175 | 4,824 | 36.4 | - | | Age group 61 and older, inactive | 0 | 0 | 0 | 0.0 | - | | Age group 61 and older, active | 119 | 112 | 231 | 1.7 | - | P2 | INFOCLASS = sum of working in the branches of Infosphere | 13 | 2 | 14 | 0.1 | 0.4 | P3 | ORGCLASS = sum of working in the branches of Orgsphere | 141 | 2 | 143 | 1.1 | 4.1 | | O Public administration and defence; compulsory social security | 35 | 1 | 36 | 0.3 | 1.0 | | K Financial and insurance activities | 8 | 0 | 8 | 0.1 | 0.2 | | Other | 97 | 2 | 99 | 0.7 | 2.8 | P4 | TECHNOCLASS = sum of working in the branches of Technosphere | 1,871 | 562 | 2,433 | 18.3 | 69.0 | | AAgriculture, forestry and fishing | 1,050 | 321 | 1,370 | 10.3 | 38.9 | | CManufacturing | 154 | 221 | 375 | 2.8 | 10.6 | | FConstruction | 225 | 3 | 227 | 1.7 | 6.4 | | GWholesale and retail trade; repair of motor vehicles and motorcycles | 60 | 0 | 60 | 0.5 | 1.7 | | Other | 383 | 18 | 400 | 3.0 | 11.4 |
Ps. In our innovative research, which is conducted for the first time, you can find terminological and statistical errors removable in the subsequent practice of these researches. 14. Conclusion In the country human development sphere (sociosphere) education and health cover the employed only 5 to 6 percent of the total employed population in the Country that have negative impact on the human development indices: Pakistan has the lowest literacy rate in the region. The Country also facing serious health problems, Pakistan has the highest maternal mortality rate. Due to high population growth, we have about 40 percent population below ten years of age, resulting high dependency ratio, transpires that around 70 percent population depends upon 30 percent working class in all spherons for their livelihood. Info and Org classes also have negligible share, while Technoclass is showing visible share. Poor sociosphere, which includes education, health indices and social care dependency rate add to restlessness and is hazardous to peace and prosperity. Statistical Research has a great role to play in achieving balance and harmony in Pakistan’s spherons. This is the only scientific way to strategize for structural balance in overcoming poverty, corruption and inequality. The Pakistan’s spheronsresearch will provide fundamental information that is necessary to achieve an optimal balance in the structural harmony of spherons and spheres of social production. Achieving spheral balance and harmony will ensure the creation and harmonization of the necessary strategies for overcoming poverty, corruption and inequality. This will bring lasting peace and prosperity to the country. We understand that our first statistical research of Pakistan’s spherons is only the first swallow and the initial step on the long journey of innovative statistical digital studies of the country’s social production as a whole. only its holistic spheral research using spheral statistics and its universal digital technology (SIST) [3] will provide the country's leadership with a large-scale monitoring of the dynamics of all spheral imbalances and disproportions in the country. This will allow developing an effective long-term economic, political, demographic and social policy that prevents crises and conflicts in the framework of ensuring and strengthening a lasting sustainable peace from the structural harmony of Pakistani spherons. To this end, the country needs priority investment and the development of appropriate scientific innovations and spheral statistical digital technologies. The same conclusion is for global peace. If such researches and their practical peacemaking consequences are obvious for separate countries, then they are adequate for other countries and for the gradual provision of global peace and prosperity of all nations on the basis of scientific knowledge and governance of the spherons’ structural harmony that generate them. This first statistical proof and the study of Pakistani spherons has great scientific, political, economic and peacemaking significance for the country. But it requires expansion both in time and in depth, in the provinces and in large cities, which will create spheral macro statistical map (Socionome) of its state and development with all its positive and negative trends, including trends in the growth of social tensions between the spherons in different regions and at different stages. This knowledge will allow the country's leadership to find harmonious ways to overcome these disharmonies and ensure a stable peace from the structural genetics of national spherons. But this requires a lot of innovative scientific and practical work in the future, which is just beginning and which will undoubtedly reach the level of conscious building global peace from its structural genetics. It is our scientific vision of national and global peace in the 21st century. References 1. Semashko Leo and 173 coauthors from 34 countries. Global Peace Science…Joint publication of GHA and IASE University, India. World textbook. The first publication in English, Smaran Publication, New Delhi. 2016. 616 p. ISBN 978-81-929087-8-6: http://peacefromharmony.org/docs/global-peace-science-2016.pdf 2. Pakistan Labour Force Survey 2014-15 3. Semashko Leo and the GHA coauthors (2018) Spherons: Global Peace Genetics of the XXI century. International Spheral Statistics: http://peacefromharmony.org/?cat=en_c&key=836 4. Kashina Olga and Semashko Leo (2014) Statistics of SPHERONS of Russia for 2010: Methodology, Sources and Number: http://peacefromharmony.org/?cat=en_c&key=593 5. Semashko Leo and the GHA coauthors (2012) The ABC of Harmony for World Peace (2012): http://peacefromharmony.org/?cat=en_c&key=486 6. Hornung Bernd, Scott Bernard, Semashko Leo (2003) Tetrasociology and sociocybernetics: Towards a comparison of the key concepts:http://www.peacefromharmony.org/?cat=en_c&key=160 7. Stephen Amoah and Ayo Ayoola-Amale (2018) Global Peace Science: Structural Harmony of Spherons and Statistics of Ghana’s Spherons for 2010, 2000 and 1984: http://peacefromharmony.org/?cat=en_c&key=836 Dr. Noor M. Larik:worked as Director General, Pakistan's Federal Bureau of Statistics as head of the organization, Ministry of Finance; Chief Statistician, Pakistan Council for Science and Technology (PCST). Email: nmlarik@hotmail.com Ms. Rashida Bokhari: worked as Principal, Training wing of Federal Bureau of Statistics (now Pakistan Bureau of Statistics). Email: rashida.bokhari@hotmail.com Syed Mazhar H. Hashmi: Worked as Deputy Director General, Federal Bureau of Statistics (now Pakistan Bureau of Statistics), also headed the FBS as acting Director General. Presently working as free-lance consultant. Also worked as National Statistical Advisor for the Pakistan demographic and Health Survey, 2011-12.E-mail: mazharibd@gmail.com Zia-ul-Islam:Started career as Statistical Assistant from Pakistan Institute of Development Economics then joined Federal Bureau of Statistics and got premature retirement as Chief Statistical Officer from Pakistan Bureau of Statistics and now working as consultant on various projects relating to statistical analysis and research. Currently involved in Socio-Economic Survey (baseline 2018) for Balochistan province. E-mail: hdrziaulislam@gmail.com
---------------------------------------------------------------------------------------------------------------------------
Table 1: SPHERONS of Mauritius, 2011 in millions of people
Spheral Indices | The employed in branches of Four Spheres | Year: 2011 | % | P | All population of Mauritius: P= P1+P2+P3+P4 | 1.26 | 100 | P1 | SOCIOCLASS: P1= P1w + Pn | 0.55 | 43.9 | P1w | P1w = Sum of employed (working) in the branches of Sociosphere | 0.15 | 12.3 | | PEDUCATION | 0.03 | 2.4 | | QHEALTH AND SOCIAL WORK | 0,02 | 1.5 | | SOTHER COMMUNITY,SOCIAL& PERSONALSERVICE ACTIVITIES |
0.11 | 8.4 | Pn | Pn = Employed of Self-Production , sum of nonworking | 0.40 | 31.6 | | Did home duties (household chores/full time homeworker) | 0.19 | 15.3 | | In full time education / student | 0.08 | 6.0 | | Pensioner / Retired | 0.08 | 6.5 | | Disabled/Too sick to work | 0.03 | 2.3 | | Too old / Too young | 0.01 | 0.4 | | Other | 0.02 | 1.2 | P2 | INFOCLASS = Sum of employed in the branches of Infosphere: | 0.14 | 11.4 | | COMMUNICATION | 0.04 | 3.2 | | Science and Scientific Services | 0.10 | 8.2 | P3 | ORCLASS = Sum of employed in the branches of Orgsphere: | 0.17 | 13.3 | | OPublic Administration & Defense | 0.06 | 4.8 | | KFinancial Intermediation | 0.01 | 1.1 | | UActivities of extra territorial organization | 0.09 | 7.3 | P4 | TECHNOCLASS = Sum of employed in the branches of Technosphere: | 0.40 | 31.5 | | AAgriculture, Forestry & Fishing | 0.04 | 2.9 | | BMining & Quarrying | 0.09 | 7.4 | | CManufacturing | 0.10 | 7.7 | | DElectricity & Gas | 0.002 | 0.2 | | FConstruction | 0.05 | 4.2 | | GWholesale & Retail Trade | 0.07 | 5.8 | | IAccommodation & Food | 0.04 | 3.2 | | HTransport & Storage | 0.03 | 2.5 | | LReal Estate | 0.002 | 0.1 |
Table 2: SPHERONS of Ghana, 2010 in millions of people Spheral Indices | The employed in branches of Four Spheres | 2010 | % | P | All population of Ghana; P= P1+P2+P3+P4 | 24,73 | 100 | P1 | SOCIOCLASS: P1= P1w + Pn | 15,42 | 62.5 | P1w | P1w = Sum of employed (working) in the branches of Sociosphere | 1,01 | 4.1 | | PEDUCATION | 0.41 | 1.7 | | QHEALTH AND SOCIAL WORK | 0.13 | 0.5 | | SOTHER COMMUNITY,SOCIAL& PERSONALSERVICE ACTIVITIES | 0.48 | 1.9 | Pn | Pn = Employed of Self-Production , sum of nonworking | 14,41 | 58.0 | | Did home duties (household chores/full time homeworker) | 1,31 | 5.3 | | In full time education / student | 6,48 | 26.3 | | Pensioner / Retired | 0.14 | 0.6 | | Disabled/Too sick to work | 0.22 | 0.9 | | Too old / Too young | 5,87 | 23.8 | | Other | 0.38 | 1.5 | P2 | INFOCLASS = Sum of employed in the branches of Infosphere: | 0.14 | 0.6 | | COMMUNICATION | 0.04 | 0.2 | | Science and Scientific Services | 0.10 | 0.4 | P3 | ORCLASS = Sum of employed in the branches of Orgsphere: | 0.23 | 0.9 | | OPublic Administration & Defense | 0.15 | 0.6 | | KFinancial Intermediation | 0.73 | 0.3 | | UActivities of extra territorial organization | 0.003 | 0.0 | P4 | TECHNOCLASS = Sum of employed in the branches of Technosphere: | 8,87 | 36.0 | | AAgriculture, Forestry & Fishing | 4,35 | 17.6 | | BMining & Quarrying | 0.12 | 0.5 | | CManufacturing | 1,14 | 4.6 | | DElectricity & Gas | 0.02 | 0.1 | | FConstruction | 0.32 | 1.3 | | GWholesale & Retail Trade | 1,98 | 8.0 | | IAccommodation & Food | 0.57 | 2.3 | | HTransport & Storage | 0.37 | 1.5 | | LReal Estate | 0.01 | 0.0 |
Table 3:SPHERONS of Sierra Leone, 2015 in millions of people
Spheral Indices | The employed in branches of Four Spheres | 2015 | % | P | All population of Sierra Leone; P= P1+P2+P3+P4 | 7,19 | 100 | P1 | SOCIOCLASS: P1= P1w + Pn | 2,33 | 32.8 | P1w | P1w = Sum of employed (working) in the branches of Sociosphere | 0.15 | 2.1 | | PEDUCATION | 0.04 | 0.5 | | QHEALTH AND SOCIAL WORK | 0.04 | 0.6 | | SOTHER COMMUNITY,SOCIAL& PERSONALSERVICE ACTIVITIES | 0.07 | 1.0 | Pn | Pn = Employed of Self-Production , sum of nonworking | 2,18 | 30.7 | | Did home duties (household chores/full time homeworker) | 0.34 | 4.8 | | In full time education / student | 1. 51 | 21.3 | | Pensioner / Retired | 0.03 | 0.4 | | Disabled/Too sick to work | 0.02 | 0.3 | | Too old / Too young | 0.22 | 3.1 | | Other | 0.06 | 0.8 | P2 | INFOCLASS = Sum of employed in the branches of Infosphere: | 0.03 | 0.4 | | COMMUNICATION | 0.03 | 0.4 | | Science and Scientific Services | 0.01 | 0.1 | P3 | ORCLASS = Sum of employed in the branches of Orgsphere: | 0.12 | 1.6 | | OPublic Administration & Defense | 0.08 | 1.1 | | KFinancial Intermediation | 0.01 | 0.1 | | UActivities of extra territorial organization | 0.03 | 0.4 | P4 | TECHNOCLASS = Sum of employed in the branches of Technosphere: | 4,62 | 65.1 | | AAgriculture, Forestry & Fishing | 3,81 | 53.8 | | BMining & Quarrying | 0.06 | 0.9 | | CManufacturing | 0.08 | 1.2 | | DElectricity & Gas | 0.10 | 1.3 | | FConstruction | 0.01 | 0.1 | | GWholesale & Retail Trade | 0.05 | 0.8 | | IAccommodation & Food | 0.07 | 0.9 | | HTransport & Storage | 0.44 | 6.1 | | LReal Estate | 0.01 | 0.1 |
Table 4: SPHERONS of Tanzania, 2012 in millions of people Spheral Indices | The employed in branches of Four Spheres | 2012 | % | P | All population of Tanzania: P= P1+P2+P3+P4 | 24.59 | 100 | P1 | SOCIOCLASS: P1= P1w + Pn | 9.49 | 38.6 | P1w | P1w = Sum of employed (working) in the branches of Sociosphere | 0.74 | 3.0 | | PEDUCATION | 0.27 | 1.1 | | QHEALTH AND SOCIAL WORK | 0.10 | 0.4 | | SOTHER COMMUNITY,SOCIAL& PERSONALSERVICE ACTIVITIES | 0.36 | 1.5 | Pn | Pn = Employed of Self-Production , sum of nonworking | 8.75 | 35.6 | | Did home duties (household chores/full time homeworker) | 0.86 | 3.5 | | In full time education / student | 1.20 | 4.1 | | Pensioner / Retired | 2.57 | 10.5 | | Disabled/Too sick to work | 0.86 | 3.5 | | Too old / Too young | 0.86 | 3.5 | | Other | 2.58 | 10.5 | P2 | INFOCLASS = Sum of employed in the branches of Infosphere: | 0.23 | 0.9 | | COMMUNICATION | 0.69 | 0.3 | | Science and Scientific Services | 0.16 | 0.6 | P3 | ORCLASS = Sum of employed in the branches of Orgsphere: | 0.35 | 1.4 | | OPublic Administration & Defense | 0.21 | 0.8 | | KFinancial Intermediation | 0.14 | 0.6 | | UActivities of extra territorial organization | | | P4 | TECHNOCLASS = Sum of employed in the branches of Technosphere: | 14.53 | 59.1 | | AAgriculture, Forestry & Fishing | 11.35 | 46.1 | | BMining & Quarrying | 0.45 | 1.8 | | CManufacturing | 0.57 | 2.32 | | DElectricity & Gas | 0.07 | 0.3 | | FConstruction | 0.43 | 1.8 | | GWholesale & Retail Trade | 1.10 | 4.4 | | IAccommodation & Food | 0.33 | 1.3 | | HTransport & Storage | 0.24 | 1.0 | | LReal Estate | - | |
Table 5: SPHERONS of Botswana, 2012 in millions of people Spheral Indices | The employed in branches of Four Spheres | 2012 | % | P | All population of Botswana; P= P1+P2+P3+P4 | 2.02 | 100 | P1 | SOCIOCLASS: P1= P1w + Pn | 0.71 | 35.4 | P1w | P1w = Sum of employed (working) in the branches of Sociosphere | 0.13 | 6.8 | | PEDUCATION | 0.05 | 2.5 | | QHEALTH AND SOCIAL WORK | 0.02 | 1.2 | | SOTHER COMMUNITY,SOCIAL& PERSONALSERVICE ACTIVITIES | 0.06 | 3.1 | Pn | Pn = Employed of Self-Production , sum of nonworking | 0.57 | 28.6 | | Did home duties (household chores/full time homeworker) | 0.29 | 14.5 | | In full time education / student | 0.19 | 9.8 | | Pensioner / Retired | 0.001 | 0.0 | | Disabled/Too sick to work | 0.06 | 3.0 | | Too old / Too young | 0.01 | 0.8 | | Other | 0.009 | 0.5 | P2 | INFOCLASS = Sum of employed in the branches of Infosphere: | 0.80 | 39.6 | | COMMUNICATION | 0.40 | 19.8 | | Science and Scientific Services | 0.40 | 19.8 | P3 | ORCLASS = Sum of employed in the branches of Orgsphere: | 0.11 | 5.6 | | OPublic Administration & Defense | 0.06 | 3.4 | | KFinancial Intermediation | 0.01 | 0.5 | | UActivities of extra territorial organization | 0.03 | 1.6 | P4 | TECHNOCLASS = Sum of employed in the branches of Technosphere: | 0.39 | 19.4 | | AAgriculture, Forestry & Fishing | 0.09 | 4.8 | | BMining & Quarrying | 0.01 | 0.9 | | CManufacturing | 0.03 | 1.6 | | DElectricity & Gas | 0.005 | 0.3 | | FConstruction | 0.05 | 3.0 | | GWholesale & Retail Trade | 0.08 | 4.3 | | IAccommodation & Food | 0.01 | 0.8 | | HTransport & Storage | 0.02 | 1.1 | | LReal Estate | 0.05 | 2.6 |
Co-Authors:
1.Dr. Ayo Ayoola-Amaleemail: aayoamale@gmail.com, ayo@growintopeace.com LLB, BL, LLM (LAW), LLM (ADR), PEM (ADR), PGD,IT LAW, MCiarb,(UK) Lead, First Conflict Resolution Services Inc., 2.Stephen Kwaku Amoah email: stephen.amoah@statsghana.gov.gh, steveamoah@gmail.com. PhD Applied Statistics (post graduate student UDS), MSc Statistics (Univ. of Cape Coast), BSc Statistics and Psychology (Univ. of Ghana, Legon). Current Employment and Position: Ghana Statistical Service .Director, Coordination and Program Management Directorate. 3. Stephen Tabi: email: stephen.tabi@statsghana.gov.gh. MSc Statistics, BSc Statistics, Regent University College of Science And Technology, Bachelor of Management Studies, University of Cape-Coast, Cape-Coast,HND Statistics, Koforidua Polytechnic, Koforidua. Current employment and Position: Ghana Statistical Service, Statistician, M&E Unit Sources 1.Ghana Statistical Service. GSS (2012). 2010 Population and Housing Census Summary Report of final Results. 2.Ghana Statistical Service. GSS (2012). 2010 Population and Housing Census Economic Activities in Ghana. 3.Ghana Statistical Service. GSS (2013) 2010 Population and Housing Census National Analytical Report (2013). 4.Ghana Statistical Service. GSS (2016). 2015 Labour force report. 5.http://www.statsghana.gov.gh 6.Statistics Sierra Leone. 2015 Population and housing census summary of final results 7.StatisticsSierra Leone 2015 Population and Housing Census - Summary of Final Results 8.StatisticsSierra Leone. 2014 Labour Force Survey Report - 22 September 2015 9.https://www.statistics.sl/index.php/census/census-2015.html 10.2011 Housing and Population Census, Mauritius 11.http://statsmauritius.govmu.org/English/Pages/Housing-and-Population-Census-2011.aspx 12.http://statsmauritius.govmu.org/English/CensusandSurveys/Documents/ESI/toc1.htm 13.Tanzania - Population and Housing Census 2012 14.https://africaopendata.org/dataset/a476b234-dc4a-4d86-8fda-bf5c6bdb1007/resource/f4ec0f20-98b3-4ccd-ab37-9633e8517b22/download/2012-population-and-housing-census---descriptive-tables---zanzibar.pdf 15.http://www.tzdpg.or.tz/fileadmin/documents/dpg_internal/dpg_working_groups_clusters/cluster_2/water/WSDP/Background_information/2012_Census_General_Report.pdf -----------------------------------------------------------------------------
Statistics of the India’s Spherons (spheral classes) By Prof. Maitreyee Bardhan Roy The Spherons constitutes global societal structure and the actors of humanity survival including India. The Spherons Statistics is the proof of their reality, their measurement and the degree of their knowledge and its digitalization. Spherons are the source of humanity life, the foundation of all its higher and eternal values: Harmony, Peace, Solidarity, Nonviolence, Justice, Unity, Freedom, Equality, Fraternity, Love and Happiness. Spherons are all the more important the larger the population of the country, so their knowledge is especially important for India as the second largest country in the world by population.
Table-1. The number of Spherons of India in 2011 census* in million people.
Spheral Indices | Population = the employed in four spheres of social production = The sum of working + non-working population | 2011 | % | P | All Population of (India): P = P1+P2+P3+P4 | 1210.569573 | 100 | P1 | Spheron-1: P1 = P1w + P1n | 121.06=48.18 +72.88 | 99.49%=39.29+60.2% | P1w | P1w = sum of the working in the branches of Sociosphere: | 7.248860 | 39.29% | | HEALTH AND SOCIAL WORK | 18122155 | 40.5 | | EDUCATION | 223989774 | 30.9 | | CHURCH | 1812215 | 2.5 | | SPORT | 7611303 | 10.5 | | Others: social insurance, social help and care etc. | 360993228 | 49.8 | P1n | P1n = sum of the non-working, economic inactive population: | 626 376 000 | 60.2% | | Age group 0–15 years old, children: | 3668392645 | 33 | | The age group over 16, not active (students, non-working pensioners, disabled people, housewives, etc.): | 47200000 | 34 | | Age group over 16, unemployed, homeless, etc. | 96360 | 5 | | Others: | 236850 (beggar) | 10.3 | P2 | Spheron-2 = sum of working in the branches of Infosphere: | 630829 | 8.7 | | COMMUNICATION | 327300 | 10.2 | | SCIENCE AND SCIENTIFIC SERVICE; Designing | 12178 | 5.3 | | CULTURE, Art | 2491 | 5.6 | | MEDIA,ADVERTISING | 63200 | 4.4 | | INFORMATION SERVICE | 225660 | 3.5 | | Others Home based service | 3000000 | 5.5 | P3 | Spheron-3 = sum of working in the branches of Orgsphere: | 2900000 | 40 | | PUBLIC ADMINISTRATION, DEFENCE and SECURITY | 782338 | 8.6 | | FINANCIAL INTERMEDIATION | 1270658 | 10.0 | | Others: public organizations, etc. | 1124439 | | P4 | Spheron-4: = sum of working in the branches of Technosphere: | 26484 | 0.36 | | AGRICULTURE, HUNTING AND FORESTRY FISHING | 176929 | 54..6 | | MINING AND QUARRYING | 1908 | 0.6 | | MANUFACTURING | 48357 | 22.74 | | ELECTRICITY, GAS AND WATER SUPPLY | 1546 | 0.5 | | CONSTRUCTION | 11583 | 3.7 | | WHOLESALE AND RETAIL TRADE; REPAIR | 29333 | 9.4 | | HOTELS AND RESTAURANTS | 4,060,793 | | | TRANSPORT AND STORAGE | 12535 | 4.0 | | REAL ESTATE, RENTING AND BUSINESS ACTIVITIES | 3109 | 2.0 | | Others: nature conservation, folk crafts, etc. | 31131 | 10.0 | | Statistical error | 309942 | 0.2 |
* Statistical source tittle is: Indian Labour Year Book 2011-2012. Government of India. Ministry of Labour and EmploymentLabour Bureau. Simla./ Chandigarh .Its e/address in Internet is: Available in Pdf file. (http://www.labourbureaunew.gov.in/UserContent/ILYB_2015.pdf?pr_id=zfAb%2BvimybM%3DMar31,2017) Prof. Maitreyee Bardhan Roy, Ex Principal Basanti Devi College. Emeritus Professor in Political Science. Presently working in Diamond Harbour Women University. ICSSR Senior Research Fellow. Institute of Development Studies. Kolkata. India. Research work is mainly associated to Women Issues. 18-12-18 ----------------------------------------------------------------
Statistics of the Spherons (spheral classes) Population of Hellas on 2017 Year Source: Hellenic Statistical Authority Labour Force Survey 2017 http://www.statistics.gr/en/statistics/-/publication/SJO03/2017?fbclid=IwAR0J-TPBr1N1_k9Cty_gSu9r5FSGYTiorFQ9dcmcTSjiDPyUBkxbL5b3qXk DEDICATED TO MAHATMA GANDHI, The 150th birth anniversary, October 2, 2019 Gandhi’s “The nonviolence greatest force” are Spherons Table-1. The number of Spherons of Hellas in 2017***** Year in Million people. Spheral Indices | Population = the employed in four spheres of social production; | 2017 | % | Or economically active + non-working population | P | All Population: P = P1(Pn+P1w) +P2+P3+P4; | 10738000 | 100% | Or: P = Pn + Pw | Pn | Pn = non-working population. Pn = P – Pw | 6985300 | 65,05 | Pw | Economically active population, working in four spheres. | 3752700 | 34,94 | Pw = P1w+P2+P3+P4 | P1 | Spheron-1: P1 = P1w + Pn | 7185000 | 66,91 | P1w | P1w = sum of the working in the branches of Sociosphere: | 199700 | 1,86 | | HEALTH AND SOCIAL SERVICE | 107600 | 1,00 | | EDUCATION | 92100 | 0,85 | P2 | Spheron-2 = sum of working in the branches of Infosphere: | 318600 | 2,96 | | COMMUNICATION | 77900 | 0,72 | | SCIENCE AND SCIENTIFIC SERVICE; Designing | 199500 | 1,85 | | CULTURE, ART | 41200 | 0,38 | P3 | Spheron-3 = sum of working in the branches of Orgsphere: | 800500 | 7,45 | | PUBLIC ADMINISTRATION, DEFENCE and SECURITY | 330600 | 3,07 | | FINANCIAL INTERMEDIATION | 15300 | 0,14 | | Others: public organizations, etc. | 454600 | 4,23 | P4 | Spheron-4: = sum of working in the branches of Technosphere: | 2433900 | 22,67 | | AGRICULTURE, HUNTING, FORESTRY, FISHING | 450900 | 4,19 | | | | | | MINING AND QUARRYING | 9200 | 0,08 | | MANUFACTURING | 352000 | 3,27 | | ELECTRICITY, GAS AND WATER SUPPLY | 16700 | 0,15 | | CONSTRUCTION | 148400 | 1,38 | | WHOLESALE AND RETAIL TRADE; REPAIR | 676600 | 6,30 | | HOTELS AND RESTAURANTS (OTHERS) | | | | TRANSPORT AND STORAGE | 163100 | 1,51 | | REAL ESTATE, RENTING AND BUSINESS ACTIVITIES (OTHERS) | | 0 | | Others: nature conservation, folk crafts, water supply; sewerage, waste management and remediation, hotels, restaurants, real estate, rending, business activities, etc. | 617000 | 5,74 | | Statistical error | | |
SHPERONS POPULATION – HELLAS Spheral Demographic Structure Population/People P = P1(P1w+Pn) + P2 + P3 +P4
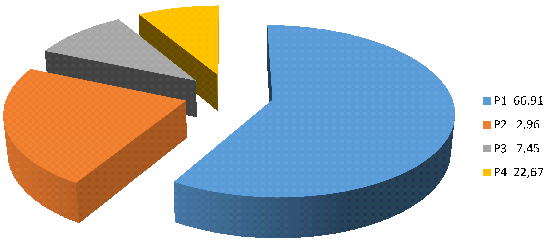
Dr. Takis Ioannides Historian, writer, Athens, Greece https://peacefromharmony.org/?cat=en_c&key=138 15-12-18 -----------------------------------------------------------------
France Spherons Statistics on 2015, in millions* By Théa Marie Robert DEDICATED TO MAHATMA GANDHI,The 150th birth anniversary, October 2, 2019 Spheral Indices | Population = the employed in four spheres of social production; Or economically active + non-working population | 2015 | % | P | All Population: P = P1(Pn+P1w)+P2+P3+P4; Or: P = Pn + Pw | 66,59 | 100 | Pn | Pn = non-working population. Pn = P – Pw | 38,56 | 57,91 | Pw | Economically active population, working in four spheres. + included workers looking for job Pw = P1w+P2+P3+P4 | 28,03 | 42,09 | P1 | Spheron-1: P1 = P1w + Pn | 42, 6 | 64 | P1w | P1w = sum of the working in the branches of Sociosphere: | 4,05 | 6,1 | | HEALTH AND SOCIAL SERVICE and education | | | | EDUCATION | | | P2 | Spheron-2 = sum of working in the branches of Infosphere: | 3.74 | 5.54 | | COMMUNICATION | 0,723 | 1,01 | | SCIENCE AND SCIENTIFIC SERVICE; Designing | 2,45 | 3,68 | | CULTURE, ART | 0,568 | 0,85 | P3 | Spheron-3 = sum of working in the branches of Orgsphere: | 4,2 | 6,3 | | PUBLICADMINISTRATION,DEFENCEandSECURITYinclude into spheron 1 ( state services ) | 3,33 | 5 | | FINANCIAL INTERMEDIATION | 0,87 | 1,3 | | Others: public organizations, etc. | | | P4 | Spheron-4: = sum of working in the branches of Technosphere: | 16.2 | 24.39 | | AGRICULTURE, HUNTING AND FORESTRY and fishing | 0,69 | 1,05 | | FISHING | | | | MINING AND QUARRYING | | | | MANUFACTURING | 3,59 | 5,4 | | ELECTRICITY, GAS AND WATER SUPPLY + and MINING AND QUARRYING | 4,13 | 6,2 | | CONSTRUCTION | 1,65 | 2,48 | | WHOLESALE AND RETAIL TRADE; REPAIR | 3,33 | 5 | | HOTELS AND RESTAURANTS | 0,980 | 1,47 | | TRANSPORT AND STORAGE | 1,445 | 2,17 | | REAL ESTATE, RENTING AND BUSINESS ACTIVITIES | 0,413 | 0,62 |
Statistics France 2015 Théa Marie Robert Artist, Chamonix Mont-Blanc France https://peacefromharmony.org/?cat=en_c&key=467 21-12-18 -------------------------------------------------------------------------------------------------------------------------------------------
India Spherons Statistics of Odisha State for 2019, million people By Prof. Pravat Kumar Dhal
DEDICATED TO MAHATMA GANDHI,
The 150th birth anniversary, October 2, 2019
Spheral Indices | Population = the employed in four spheres of social production | 2015 | % | P | Odisha State All Population: P = 1(Pn+P1w)+P2+P3+P4; Or: P = Pn + Pw | 44.3 | 100% | Pn | Pn = non-working population. Pn = P – Pw | 23,9 | 54.8% | Pw | Economically active population, working in four spheres. Pw = P1w+P2+P3+P4 | 20.37 | 46 | P1 | Spheron-1: P1 = P1w + Pn | 26.04 | 58.8% | P1w | P1w = sum of the working in the branches of Sociosphere: | 7.7 | 4.0% | | HEALTH AND SOCIAL SERVICE | 4.5 | | | EDUCATION | 3.2 | | P2 | Spheron-2 = sum of working in the branches of Info sphere: | 1.125 | 46% | | COMMUNICATION | 0.372 | 2.54 | | SCIENCE AND SCIENTIFIC SERVICE; Designing | 0.265 | 0.60 | | CULTURE, ART | 0.487 | 1.10 | P3 | Spheron-3 = sum of working in the branches of Orgsphere: | 2.409 | 5.44% | | PUBLIC ADMINISTRATION, DEFENCE and SECURITY | 0.974 | 2.20 | | FINANCIAL INTERMEDIATION | 0.664 | 1.50 | | Others: public organizations, etc. | 0.53 | 1.20 | P4 | Spheron-4: = sum of working in the branches of Technosphere: | 15.31 | 34..56% | | AGRICULTURE, HUNTING AND FORESTRY | 2.95+0.615 | 6.68+1.39 | | FISHING | 0.447 | 1.01 | | MINING AND QUARRYING | 0.788 | 1.78 | | MANUFACTURING | 2.99 | 6.75 | | ELECTRICITY, GAS AND WATER SUPPLY | 0.624 | 1.41 | | CONSTRUCTION | 2.299 | 5.19 | | HOTELS AND RESTAURANTS +TRANSPORT AND STORAGE
| 2.339 | 5.28 | | REAL ESTATE, RENTING AND BUSINESS ACTIVITIES | 2.246 | 5.07 |
Spherons structural chart of Odisha state (It is requare to correct its symbols in concordance with their newest version in the table)
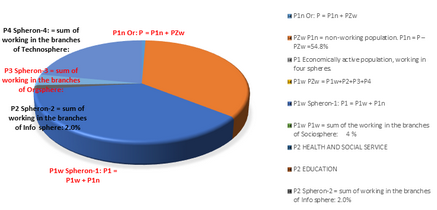
Odisha Statistics: http://www.indiaenvironmentportal.org.in/files/file/Odisha%20Economic_Survey_2014-15.pdf http://pc.odisha.gov.in/Download/Economic_Survey_2016-17.pdf http://www.desorissa.nic.in/pdf/odisha_at_glance_2016.pdf PRAVAT KUMAR DHAL, PhD Professor and Head Department of Education Magadh University, Bodhgaya, India He was born on 4th Sept.1967 in Odisha. He has more than 50 publications and 20 Awards. His areas of the study are: Educational philosophy, Value education, Peace education, Mathematics education (statistics), Guidance and counselling, educational Administration and Management etc. https://peacefromharmony.org/?cat=en_c&key=890
19-12-18 ---------------------------------------------------------
India Spherons Statistics for 2011, millions people* By Maitreyee B. Roy and Pravat K. Dhal . Spheral Indices | Population,employed in four spheres of social production | 2011 | % | P | Population of India: P=P1+P2+P3+P4 | 1210.57 | 100 | P1 | Spheron-1: P1=P1w+Pn | 827.09 | 68.3 | P1W | Sum of the working in the socio-sphere branches | 98.21 | 8.1 | Pn | Non-working population-Pn=P-Pw | 728.88 | 60.2 | Pw | Pw=working population=P1w+P2+P3+P4 | 481.68 | 39.8 | P2 | Spheron-2:sum of working in the Infosphere branches | 49.77 | 4.1 | P3 | Spheron-3: Sum of working in the Orgsphere branches | 67.30 | 5.6 | P4 | Spheron-4: Sum of working in the Technosphere branches | 266.41 | 22.0 |
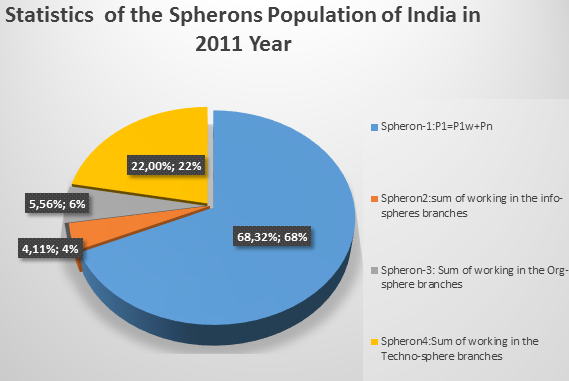
*The article full publication:
https://peacefromharmony.org/?cat=en_c&key=836
Commentary. The Spherons constitutes global societal structure and the actors of humanity survival including India. The Spherons Statistics is the proof of their reality, their measurement and the degree of their knowledge and its digitalization. Spherons are the source of humanity life, the foundation of all its higher and eternal values: Harmony, Peace, Solidarity, Nonviolence, Justice, Unity, Freedom, Equality, Fraternity, Love and Happiness. Spherons are the more important largest parts of the country population so their knowledge is especially important for India as the second largest country in the world by population. Statistical sources: 1.Indian Labour Year Book 2011-2012. Government of India. Ministry of Labour and EmploymentLabour Bureau. Simla/Chandigarh: http://www.labourbureaunew.gov.in/UserContent/ILYB_2015.pdf?pr_id=zfAb%2BvimybM%3DMar31,2017 2. Industrial Classification Data Information 2011. Office of the register General and Census Commissioner India Prof. Maitreyee Bardhan Roy, Ex Principal Basanti Devi College. Emeritus Professor in Political Science. Presently working in Diamond Harbour Women University. ICSSR Senior Research Fellow. Research work is mainly associated to Women Issue. Institute of Development Studies. Kolkata, India, maitreyee25@rediffmail.com https://peacefromharmony.org/?cat=en_c&key=481 Pravat Kumar Dhal, PhD Professor and Head Department of Education Magadh University, Bodhgaya, India https://peacefromharmony.org/?cat=en_c&key=890 -----------------------------------------------------------------------------------------------------------------------------------------------
Statistics of Magadh University (Bodhgaya, India) Spherons (spheral classes) 2018 By Prof. Pravat Kumar Dhal and Dr. Subhash Chandra The Spherons constitutes global societal structure and the actors of humanity survival including India. The Spherons Statistics is the proof of their reality, their measurement and the degree of their knowledge and its digitalization. Spherons are the source of humanity life, the foundation of all its higher and eternal values: Harmony, Peace, Solidarity, Nonviolence, Justice, Unity, Freedom, Equality, Fraternity, Love and Happiness. Spherons are all the more important the larger the population of the country, so their knowledge is especially important for India as the second largest country in the world by population.
Table-1. The number of Spherons of Magadh University, Bodhgaya, India in 2018 Spheral Indices | Population = the employed in four spheres of social production = The sum of working + non-working population | 2018 | % | P | All Population of (India): P = P1+P2+P3+P4 | 9349+266+307+119=10041 | 100 | P1 | Spheron-1: P1 = P1w + Pn | 9349 | 93.10 | P1w | P1w = sum of the working in the branches of Socio-sphere: | 1732 | 17.24 | | HEALTH AND SOCIAL WORK | 23 | | | EDUCATION | 1670 | | | Temple | 04 | | | SPORT | 22 | | | Others: social insurance, social help and care etc. | 13 | | Pn | Pn = sum of the non-working, economic inactive population, students | 7617 | 75.85 | P2 | Spheron-2 = sum of working in the branches of Info-sphere: | 266 | 2.64 | | COMMUNICATION | 19 | | | SCIENCE AND SCIENTIFIC SERVICE; Designing | 1 70 | | | CULTURE, Art | 24 | | | MEDIA,ADVERTISING | 13 | | | INFORMATION SERVICE | 07 | | | Others Home based service | 43 | | P3 | Spheron-3 = sum of working in the branches of Org-sphere: | 307 | 3.05 | | PUBLIC ADMINISTRATION, DEFENCE and SECURITY | 236 | | | FINANCIAL INTERMEDIATION | 34 | | | Others: public organizations, etc. | 37 | | P4 | Spheron-4: = sum of working in the branches of Techno-sphere: | 119 | 1.18 | | AGRICULTURE, HUNTING AND FORESTRY FISHING | 14 | | | MINING AND QUARRYING | ---- | | | MANUFACTURING | --- | | | ELECTRICITY, GAS AND WATER SUPPLY | 32 | | | CONSTRUCTION | 14 | | | WHOLESALE AND RETAIL TRADE; | 7 | | | HOTELS AND RESTAURANTS | 06 | | | TRANSPORT AND STORAGE | 27 | | | REAL ESTATE, RENTING AND BUSINESS ACTIVITIES | 12 | | | Others: nature conservation, folk crafts, etc. | 07 | |
Magadh University Spherons Statistics for 2018 By Prof. Pravat Kumar Dhal and Dr. Subhash Chandra Publication: https://peacefromharmony.org/?cat=en_c&key=836
Spheral Indices | Population,employed in four spheres of the University, persons | 2018 | % | P | All employed in the University (U): P = P1 + P2 + P3 + P4 | 10041 | 100 | P1 | (U) Spheron-1: P1 = P1w + Pn | 9349 | 93.10 | P1w | (U) P1w = sum of the working in the Socio-sphere branches | 1732 | 17.24 | Pn | (U) Pn = Students (nonworking) number = P - Pw | 7617 | 75.85 | Pw | (U) Pw = working population = P1w+P2+P3+P4 | 2424 | 24.14 | P2 | (U) Spheron-2 = sum of working in the Info-sphere branches | 266 | 2.64 | P3 | (U) Spheron-3 = sum of working in the Org-sphere branches | 307 | 3.05 | P4 | (U) Spheron-4: = sum of working in the Techno-sphere branches (Technical staff) | 119 | 1.18 |
Commentary. The Spherons constitutes global societal structure and the actors of humanity survival including India. The Spherons Statistics is the proof of their reality, their measurement and the degree of their knowledge and its digitalization. Spherons are the source of humanity life, the foundation of all its higher and eternal values: Harmony, Peace, Solidarity, Nonviolence, Justice, Unity, Freedom, Equality, Fraternity, Love and Happiness. Spherons are the more important largest parts of the country population so their knowledge is especially important for India as the second largest country in the world by population. Statistical source: Survey of various Departments and residences of campus of Magadh University, Bodhgaya, Dist.-Gaya, Bihar, India www.magadhuniversity.ac.in
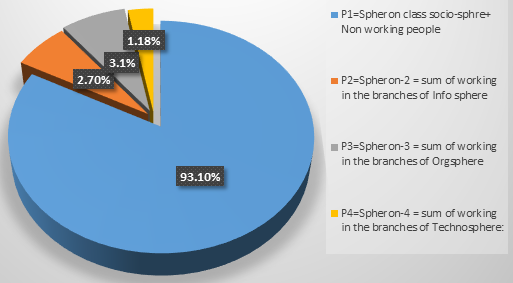
Pravat Kumar Dhal, PhD Professor and Head, Department of Education, Magadh University, Bodhgaya, India https://peacefromharmony.org/?cat=en_c&key=890
Dr. Subhash Chandra, Associate Professor (Hon.) at Intercultural Open University (IOU), NL, GHA President and GHA Board Chairman, Gurgaon, India, Web: http://peacefromharmony.org/?cat=en_c&key=583 17-05-19
------------------------------------------------------------------------------
In process
Up
|
 Official Website")